Topic Overview: Measures of Central Tendency
Overview
Measures of central tendency are an important way of understanding how data sets cluster. In this Topic Overview, we will be going over the following concepts:
- Mean
- Median
- Mode
- Range
Mean
Suppose you have a data set made up of n terms and suppose the data are arranged in order from least to greatest.:
What is the “average” of this data set? What does it even mean to talk about the average?
Suppose the data are in scattered from 0 to 100. Here’s one possible way the data points might cluster:
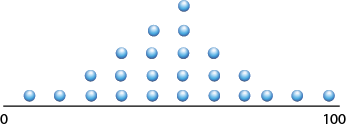
There are many other ways the data might cluster. The “average” would be the behavior of the data around the middle of the cluster of data.
The term “average” is a general term used to describe this clustering, but there are several mathematical terms that more precisely define this average. The first such term is called the mean.
Using the data set shown earlier (x1…xn), here is the formula for calculating the mean of a data set.

To see some worked-out examples of calculating the mean, click on this link to see a slide show. It includes a video, definitions, formulas, and examples.
The data set for calculating the mean can include negative numbers. To see some worked-out examples of calculating the mean when there are negative numbers in the data set, click on this link to see a slide show.
Another case to consider is what is called a “weighted average.” Click on this link to watch a slide show that explains weighted average in more detail. This includes a video tutorial on weighted averages.
Median
The mean is a very effective, precise way of finding the central tendencies of data sets. But what about when the data sets are huge? For example, if you’ve listened to news reports you’ll often hear about “median household income.” Why not the “mean household income”?
There are millions of people in the data set of “household income.” Going back to our original data set, imagine this data set consisting of millions of data points.
Imagine calculating the mean with this formula with millions of data points:
Do you see the problem? Inputting millions of data points is beyond what a spreadsheet can handle. The number of calculations involved are beyond the abilities of many computers.
So, with extremely large data sets, there’s a different “average” to use, called the median. If you arrange your data set from least to greatest, the median is the term in the middle of the data set.
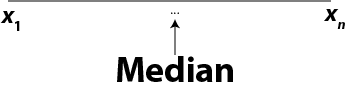
If there are an odd number of terms, the median is the middle term. For example, the median of five terms is the third term:

If there are an even number of terms, the median is the mean of two of the terms. For example, the median of six terms is the mean of the third and fourth terms.

To see some worked-out examples of finding the median, click on this link to see a slide show. It includes a video, definitions, formulas, and examples.
Mode
A third type of “average” is the mode. It’s especially useful when working with categorical data. For example, suppose you have survey data in which people select their favorite flavor of ice cream. A graph of the data set might look like this.
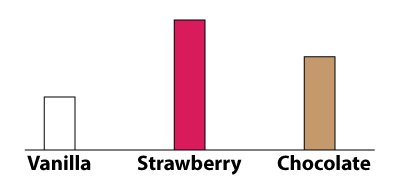
The mode is the item that occurs most often. The mode can also work with numerical data, but when all you have is categorical data, use the mode.
To see some worked-out examples of finding the mode, click on this link to see a slide show. It includes a video, definitions, formulas, and examples.
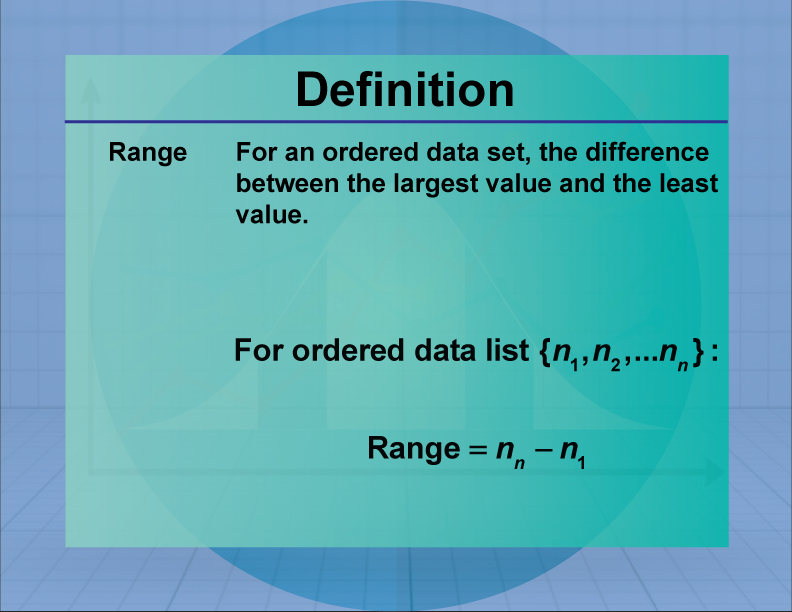
Range
Going back to the fictitious data set we’ve been looking at:
If this data set is arranged in order from least to greatest, then the range of values is the difference between the greatest value and the least value.
About Media4Math
All of the resources in this overview can be found on Media4Math. Subscribers can download these resources, or create their own slide shows using Slide Show Creator.