Topic Overview: Linear Functions and Equations
Overview
Before studying what a linear function is, make sure you are comfortable with the following concepts, which we will also review:
- What a function is
- Independent variable
- Dependent variable
- Domain
- Range
- Different representations of functions
Brief Review of Functions
What Is a Function? A function is a one-to-one mapping of input values (the independent variable) to output values (the dependent variable). Click on this link to see a quick tutorial on what a function is. This slide show goes over the following key points:
- For every input value (x), there is a unique output value, f(x).
- Functions can be represented as equations, tables, and graphs.
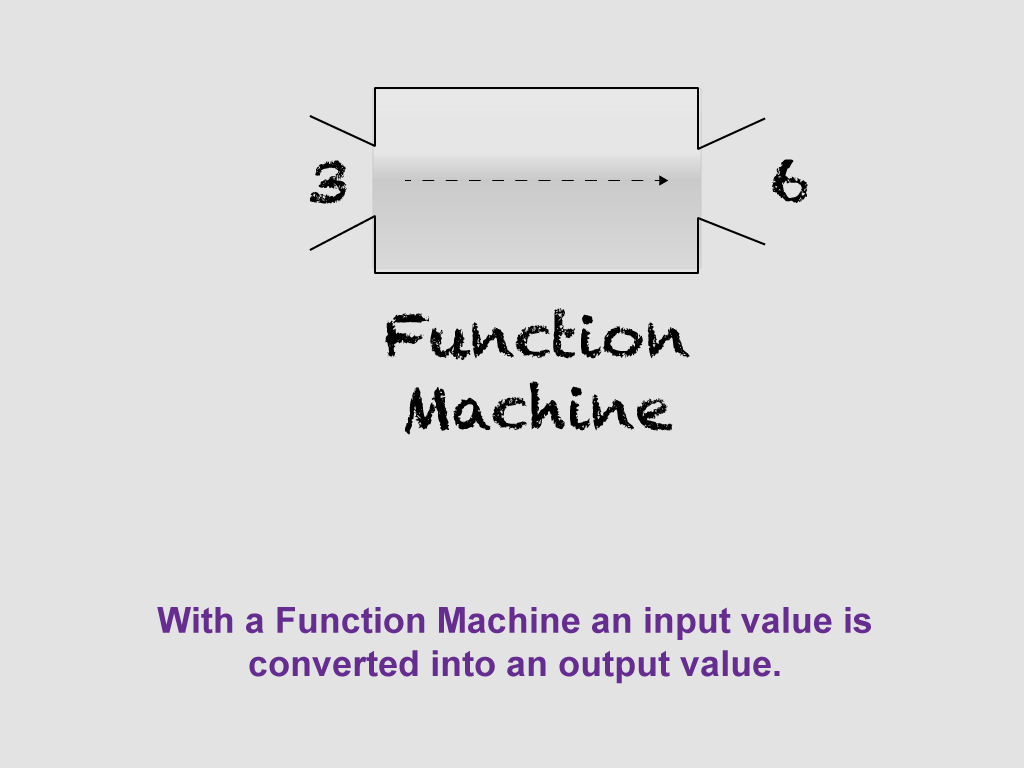
- A function machine is a useful visual representation of the input/output nature of functions.
Dependent/Independent Variables. When one variable depends on another, then it is the dependent variable. For example, the faster your speed, the farther you travel. Suppose that speed is represented by the variable s and the distance traveled is represented by the variable d.
Here’s how to describe the relationship between s and d:
The faster the speed, the more distance traveled.
Distance is dependent on speed.
Distance is a function of speed.
d = f(s)
When studying functions, make sure you are comfortable telling the difference between the independent variable and dependent variable. Get comfortable using function notation. To learn more about function notation, click on this link.
Domain and Range. A function shows the relationship between two variables, the independent variable and the dependent variable. The domain is the allowed values for the independent variable. The range is the allowed values for the dependent variable. The domain and range influence what the graph of the function looks like.
For a detailed review of what domain and range are, click on this link to learn more. You’ll see definitions of the terms domain and range, as well as examples of how to find the domain and range for given functions.
Multiple Representations of Functions. We mentioned previously that functions can be represented in different ways. In fact, any function can be represented by an equation, usually f(x) equal to some expression; a table; or a graph. For a detailed review of multiple representations of functions, click on this link, to see a slide show that includes examples of these multiple representations.
Linear Functions
An introduction to linear functions is a key part of the algebra curriculum. Linear functions are the foundation for learning about non-linear functions.
Because they are functions, linear functions have one-to-one mappings for each input value. Linear functions can be represented in three ways: equations, tables, and graphs. Let’s go over each representation.
Equation of a Linear Function
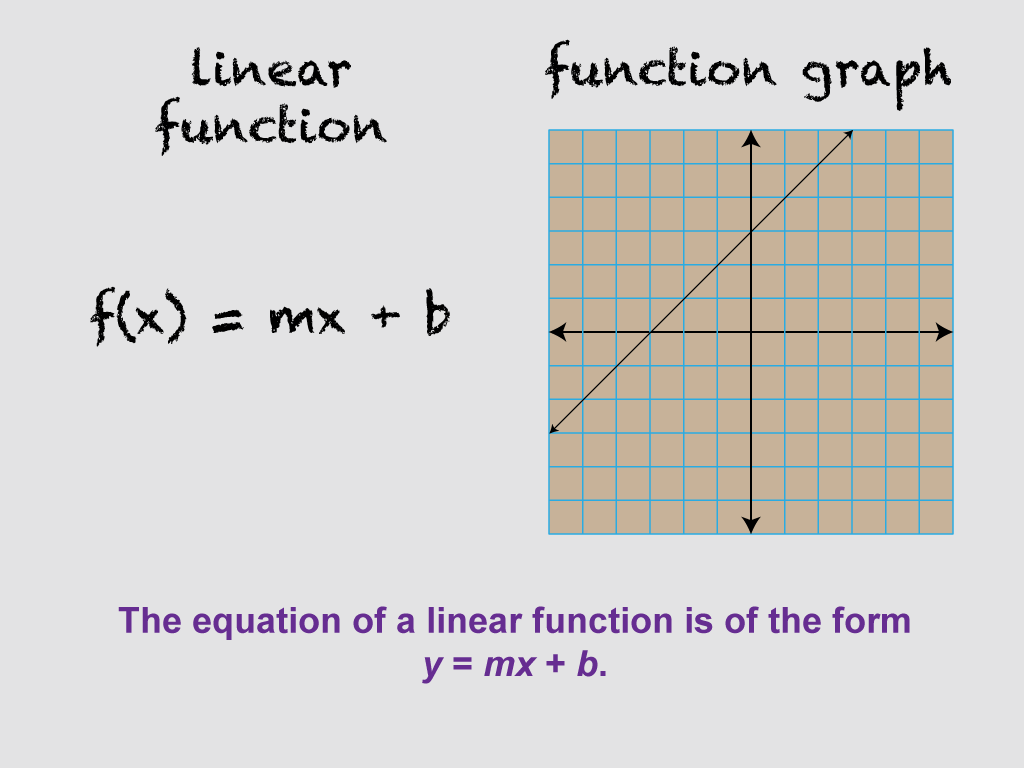
In function notation, this is the basic form of a linear function:
It is in what is called slope-intercept form. In the function shown above, m is the slope and b is the y-intercept. The graph of a linear function is a line. The independent variable is x and the dependent variable is f(x), sometimes written as y. So another way of writing the equation of a linear function is this:
The domain of a linear function is all real numbers. The range is the same. So, the graph of a linear function extends to infinity. Here are some sample linear functions.

For the first three equations, the domain and range are all real numbers. The fourth equation, also known as a constant function, the domain is all real numbers, but the range is 4. Can you see why?
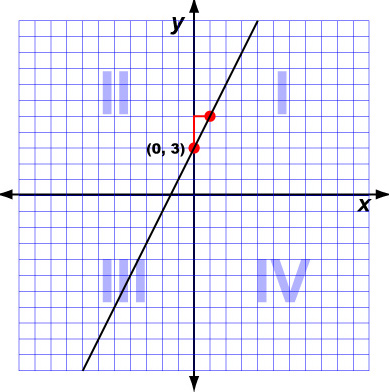
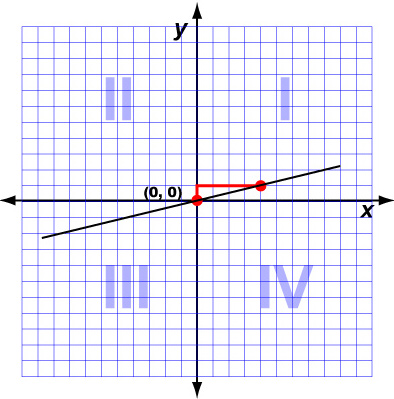
The Graph of a Linear Function
The graph of a linear function is a straight line that extends to infinity in both directions. Graphing linear functions is easily done with two key parameters, the slope and the y-intercept.
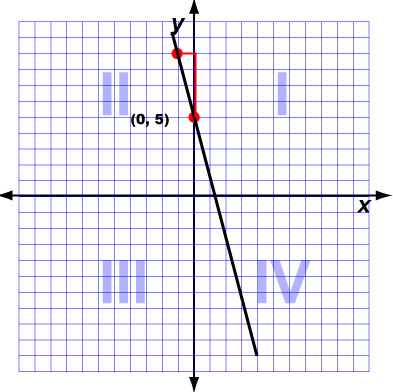
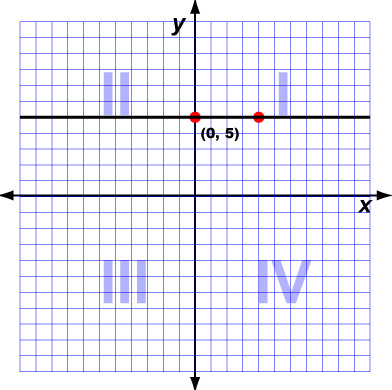
Linear function graph examples should take into account different combinations of slopes and y-intercepts. The slope of a linear function can be positive, negative, or zero.
|
|
|
|
|
|
|
|
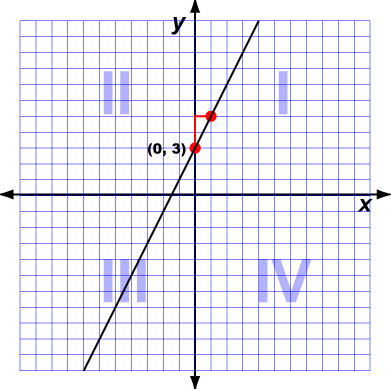
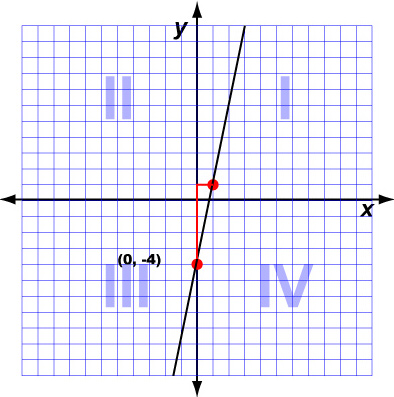
The y-intercept of a linear function can be positive, negative, or zero.
|
|
|
|
|
|
|
|
Linear Function as a Table of Values
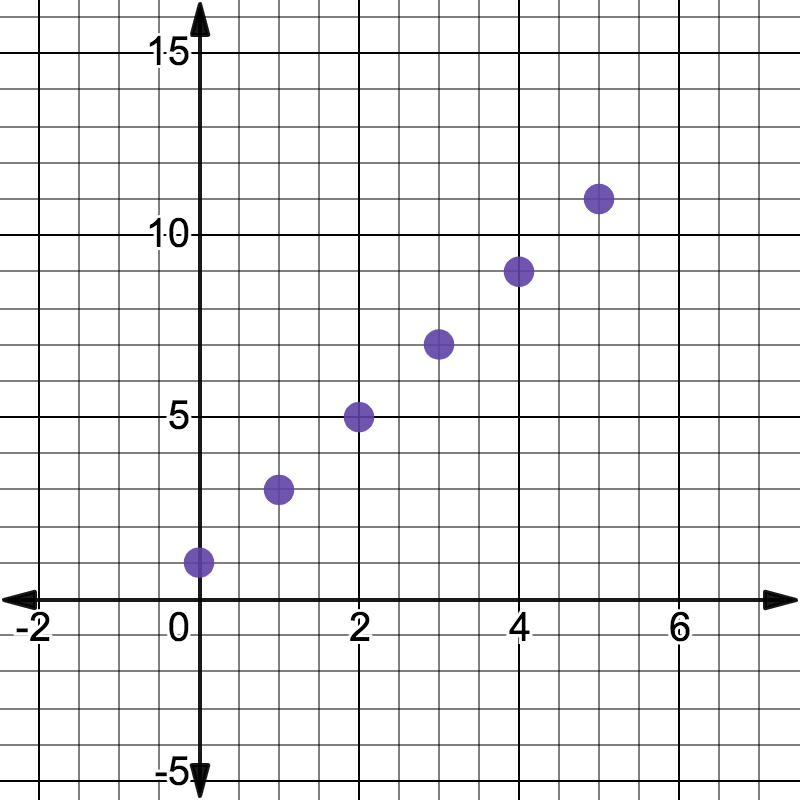
Evaluating a linear function for different input values results in corresponding output values. For example, here is a linear function evaluated for x = 0, 1, 2, 3, 4, 5.
|
|
|
This table of coordinates can be graphed on a Cartesian Coordinate Plane, like this:
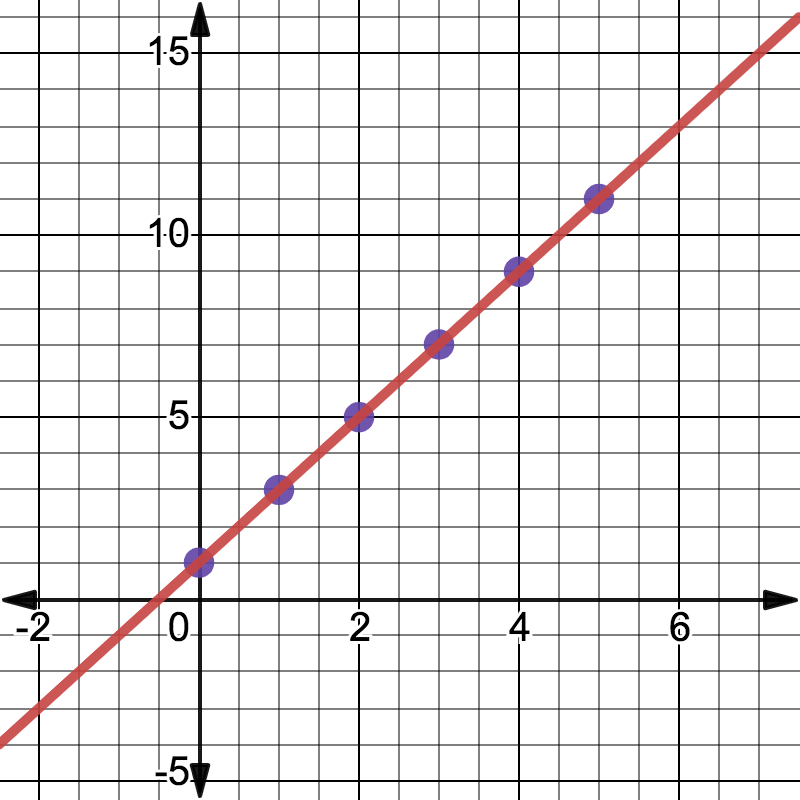
Can you see how these coordinates are all on the same line? Graphing the coordinates helps define the shape of the line. Here is the continuous graph of the function.
About Media4Math
All of the resources in this overview can be found on Media4Math. Subscribers can download these resources, or create their own slide shows using Slide Show Creator.