Digital Resources on the Topic of Probability & Statistics
|
|
| Thumbnail Image | Description | |
|---|---|---|
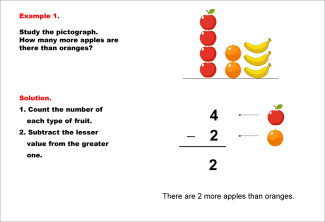
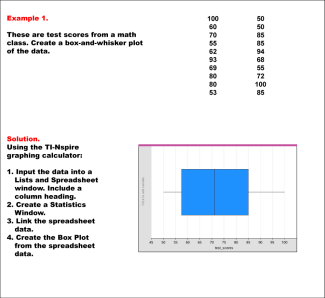
Apple Harvest |

|
Description
In this module students analyze real-world data relating to apple production and consumption. Looking at global and US data, students look at measures of central tendency by analyzing a box-and-whisker plot and later normal distribution graphs. Math topics covered include: |
Math Examples Collection: Reading Scaled Graphs |
|
This collection aggregates all the math examples around the topic of Reading Scaled Graphs. There are a total of 13 images. |
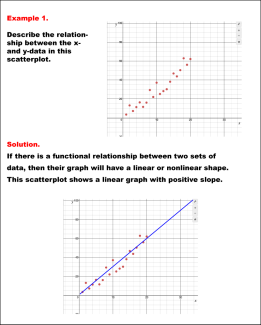
Math Examples Collection: Analyzing Scatterplots |
|
This collection aggregates all the math examples around the topic of Analyzing Scatterplots. There are a total of 10 Math Examples. |
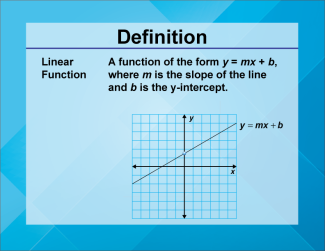
Math Video Definitions Collection: Linear Expressions, Functions, and Equations |
|
This collection aggregates all the video definitions around the topic of Linear Expressions, Functions, and Equations terms and vocabulary. There are a total of 34 videos. This collection of resources is made up of downloadable MP4 files that you can easily incorporate into a presentation. |
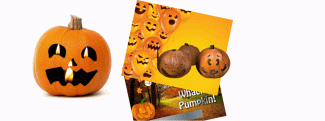
Halloween Math Collection |
|
This is a collection of Halloween-themed math clip art and other resources. There are more than 40 resources. |
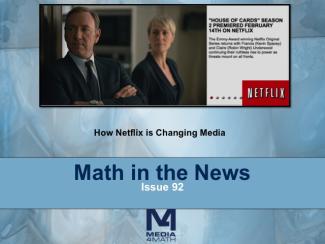
Math in the News Collection: Business Math |
|
OverviewThis is a collection of issues of Math in the News that deal with business applications. |
Math in the News Collection: Applications of Data Analysis |

|
This is a collection of Math in the News stories that focus on the topic of Data Analysis. |
Math in the News Collection: Applications of Exponential Functions |

|
OverThis is a collection of Math in the News stories that focus on the topic of Exponential Functions. |
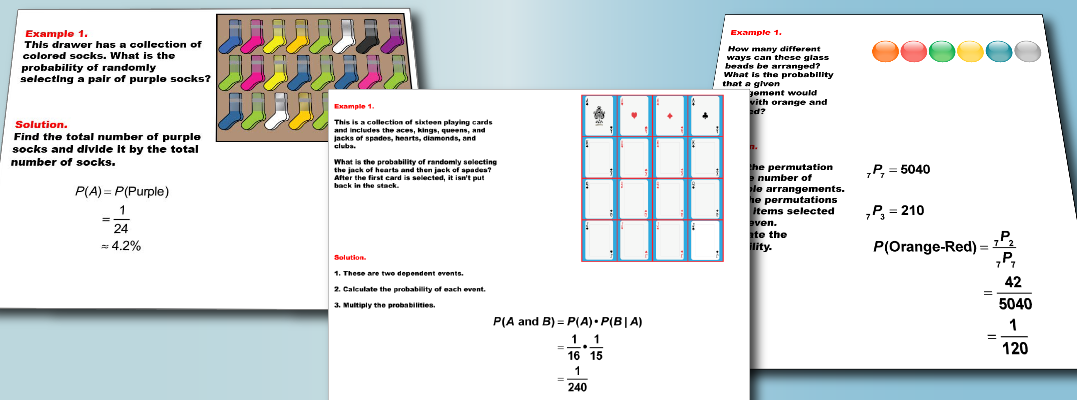
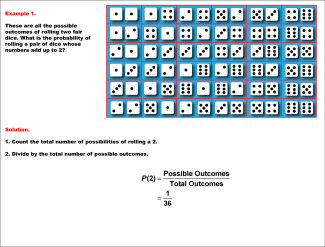
Math Examples Collection: The Probability of Independent Events |
|
This collection aggregates all the math examples around the topic of the Probability of Independent Events. There are a total of 15 |
Math Games Collection: Simulations |

|
OverviewThis is a collection of all our math simulations. There are a total of 9 games. |
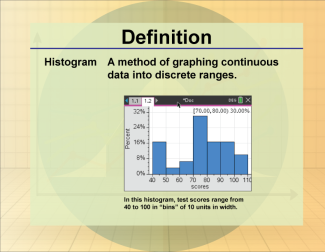
Math Examples Collection: Charts, Graphs, and Plots |
|
This collection aggregates all the math examples around the topic of Charts, Graphs, and Plots. There are a total of 38 Math Examples. This collection of resources is made up of downloadable PNG images that you can easily incorporate into your lesson plans. |
Quizlet Flash Card Collection: Measures of Central Tendency |

|
This is a collection of Quizlet Flash Cards on the topic of Measures of Central Tendency. There are a total of 20 Quizlet Flash Card sets. |
Math Games Collection: Drag-N-Drop |
|
Overview This is a collection of all our drag-n-drop math games. There are a total of 34 games. |
Math Definitions Collection: Statistics and Probability |
|
This collection aggregates all the definition image cards around the topic of Statistics and Probability terms and vocabulary. There are a total of 34 terms. |
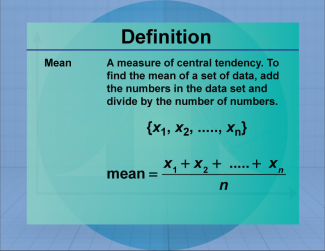
Math Definitions Collection: Measures of Central Tendency |
|
This collection aggregates all the definition image cards around the topic of Measures of Central Tendency terms and vocabulary. There are a total of 31 terms. |
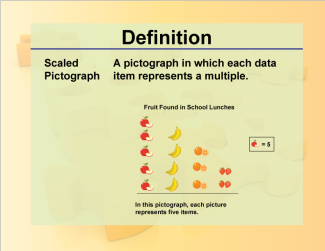
Math Definitions Collection: Charts and Graphs |
|
This collection aggregates all the definition image cards around the topic of Charts and Graphs. There are a total of 16 terms. |
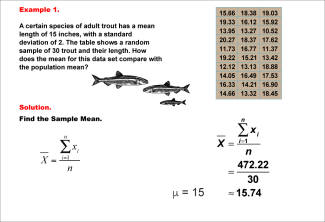
Math Examples Collection: Sample Mean |
|
This collection aggregates all the math examples around the topic of Sample Mean. There are a total of 7 images. |
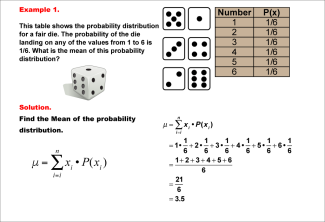
Math Examples Collection: Mean of a Probability Distribution |
|
This collection aggregates all the math examples around the topic of Mean of a Probability Distribution. There are a total of 7 images. |
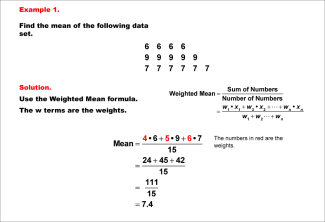
Math Examples Collection: Weighted Mean |
|
This collection aggregates all the math examples around the topic of Weighted Mean. There are a total of 9 images. |
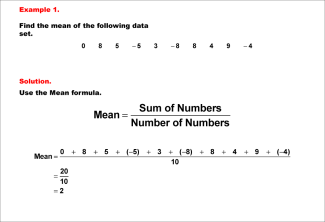
Math Examples Collection: The Mean of Data Sets with Negative Numbers |
|
OvervieThis collection aggregates all the math examples around the topic of the Mean of Data Sets with Negative Numbers. There are a total of 10 images. |
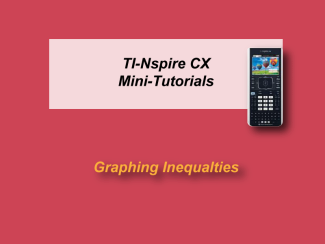
Math Video Collection: Texas Instruments Tutorial Videos |
|
Overview This colleThis collection aggregates all the math videos and resources in this series: Texas Instruments Tutorial Videos. There are a total of 266 resources. |
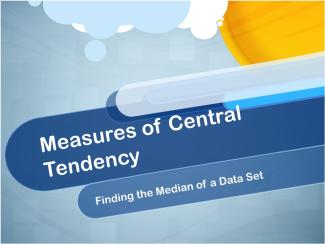
Math Video Collection: Video Tutorials Series: Measures of Central Tendency |
|
Overview This coThis collection aggregates all the math videos and resources in this series: Video Tutorials Series: Measures of Central Tendency. There are a total of 24 resources. |
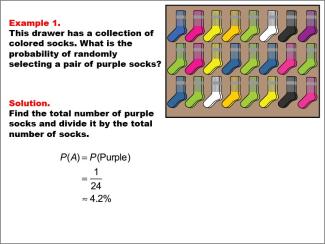
Math Examples Collection: Probability |
|
Overview This collection aggregates all the math examples around the topic of Probability. There are a total of 28 Math Examples. |
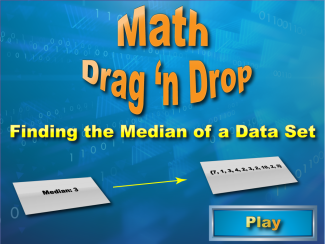
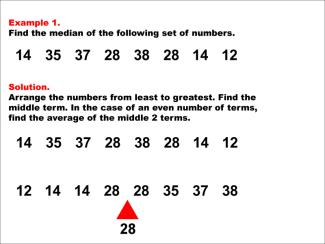
Math Examples Collection: The Median |
|
Overview This collection aggregates all the math examples around the topic of the Median. There are a total of 40 Math Examples. |
Math Examples Collection: The Mode |
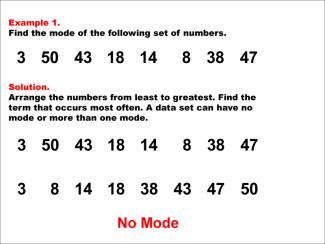
|
Overview This collection aggregates all the math examples around the topic of the Mode. There are a total of 78 Math Examples. |