Digital Resources on the Topic of Probability & Statistics
|
|
| Thumbnail Image | Description | |
|---|---|---|
Closed Captioned Video: Algebra Applications: Data Analysis |
|
Closed Captioned Video: Algebra Applications: Data Analysis
In this episode of Algebra Applications, students explore the dramatic events of 2008 related to the mortgage crisis. Brought about principally through mortgage defaults, the effect on the overall economy was severe. |
Closed Captioned Video: Algebra Applications: Data Analysis, 1 |

|
Closed Captioned Video: Algebra Applications: Data Analysis, Segment 1: Introduction
In this introductory segment students learn about the mortage crisis of 2008. In the process they get a brief introduction to what a mortgage is. |
Closed Captioned Video: Algebra Applications: Data Analysis, 2 |

|
Closed Captioned Video: Algebra Applications: Data Analysis, Segment 2: What Is a Mortgage?
The time value of money is at the basis of all loans. Students learn about the key factors that determine monthly mortgage payments and use the TI-Nspire to create an amortization table. |
Closed Captioned Video: Algebra Applications: Data Analysis, 3 |
|
Closed Captioned Video: Algebra Applications: Data Analysis, Segment 3: What Is a What is a Subprime Mortgage?
Having learned the general features of a mortgage, students learn the specifics of a subprime mortgage. With this comes the notion of a credit score, and with credit scores come the probabilities for a loan default. |
Closed Captioned Video: Algebra Applications: Data Analysis, 4 |
|
Closed Captioned Video: Algebra Applications: Data Analysis, Segment 4: What is an Adjustable Rate Mortgage?
Another factor in the mortgage crisis was the use of adjustable rate mortgages. |
Closed Captioned Video: Algebra Nspirations: Data Analysis and Probability |
|
Closed Captioned Video: Algebra Nspirations: Data Analysis and Probability
What are the two meanings of statistics? What does it really mean that an event has a 50% probability of occurring? Why are data analysis and probability always taught together? Written and hosted by internationally acclaimed math educator Dr. |
Closed Captioned Video: Algebra Nspirations: Data Analysis and Probability, 1 |

|
Closed Captioned Video: Algebra Nspirations: Data Analysis and Probability, Segment 1
In this Investigation we explore uncertainty and randomness. This video is Segment 1 of a 4 segment series related to Data Analysis and Probability. Segments 1 and 2 are grouped together. |
Closed Captioned Video: Algebra Nspirations: Data Analysis and Probability, 3 |
|
Closed Captioned Video: Algebra Nspirations: Data Analysis and Probability, Segment 3
In this Investigation we look at real-world data involving endangered wolf populations. This video is Segment 3 of a 4 segment series related to Data Analysis and Probability. Segments 3 and 4 are grouped together. |
Closed Captioned Video: Creating a Histogram |
|
Closed Captioned Video: Creating a Histogram
In this TI Nspire tutorial, the Spreadsheet and Statistics windows are used to create a histogram. This video supports the TI-Nspire Clickpad and Touchpad. This Mini-Tutorial Video includes a worksheet. . |
Closed Captioned Video: Mean of a Data List |
|
Closed Captioned Video: Mean of a Data List
In this TI Nspire tutorial, the Spreadsheet and Calculator windows are used to find the mean of a data list. This video supports the TI-Nspire Clickpad and Touchpad. This Mini-Tutorial Video includes a worksheet. . |
Closed Captioned Video: Measures of Central Tendency: Finding the Mean of a Data Set I |

|
Closed Captioned Video: Measures of Central Tendency: Finding the Mean of a Data Set I
In this video tutorial students learn how to calculate the mean when all of the data items are positive numbers. Includes three real-world examples. |
Closed Captioned Video: Measures of Central Tendency: Finding the Mean of a Data Set II |

|
Closed Captioned Video: Measures of Central Tendency: Finding the Mean of a Data Set II
In this video tutorial students learn how to calculate the mean when some of the data items are negative numbers. Includes three real-world examples. |
Closed Captioned Video: Measures of Central Tendency: Finding the Median of a Data Set |
|
Closed Captioned Video: Measures of Central Tendency: Finding the Median of a Data Set
In this video tutorial students learn how to find the median of a data set. The mean is also calculated so that students can learn similarities and differences between these two measures of central tendency. Includes three real-world examples. |
Closed Captioned Video: Measures of Central Tendency: Finding the Mode of a Data Set |

|
Closed Captioned Video: Measures of Central Tendency: Finding the Mode of a Data Set
In this video tutorial students learn how to calculate the mode of a data set, as well as how the mode differs from the mean and median.Includes three real-world examples. |
Closed Captioned Video: Measures of Central Tendency: Mean of a Probability Distribution |

|
Closed Captioned Video: Measures of Central Tendency: Mean of a Probability Distribution
In this video tutorial students learn about the mean of a probability distribution. Includes a brief discussion of expected value, plus a brief tie-in to weighted means. Includes three real-world examples. |
Closed Captioned Video: Measures of Central Tendency: Sample Mean |
|
Closed Captioned Video: Measures of Central Tendency: Sample Mean
In this video tutorial students learn about sample mean from a random sampling of data. All examples involve normally distributed data with a known population mean and standard deviation. Includes three real-world examples. |
Closed Captioned Video: Measures of Central Tendency: The Mean and Normally Distributed Data |
|
Closed Captioned Video: Measures of Central Tendency: The Mean and Normally Distributed Data
In this video tutorial students learn about normally distributed data and how to identify the population mean from the normal distribution. Standard deviation is briefly introduced. Includes three real-world examples. |
Closed Captioned Video: Measures of Central Tendency: Weighted Mean |

|
Closed Captioned Video: Measures of Central Tendency: Weighted Mean
In this video tutorial students extend their understanding of mean by looking at examples of weighted means (sometimes referred to as weighted averages). Includes three real-world examples. |
Closed Captioned Video: Median of a Data List |
|
Closed Captioned Video: Median of a Data List
In this TI Nspire tutorial, the Spreadsheet and Calculator windows are used to find the median of a data list. This video supports the TI-Nspire Clickpad and Touchpad. This Mini-Tutorial Video includes a worksheet. . |
Closed Captioned Video: Probability Simulation 1 |
|
Closed Captioned Video: Probability Simulation 1
In this TI Nspire tutorialthe Spreadsheet and Statistics windows are used to create a probability simulation of tossing two dice. This video supports the TI-Nspire Clickpad and Touchpad. This Mini-Tutorial Video includes a worksheet. . |
Closed Captioned Video: Random Number Table |
|
Closed Captioned Video: Random Number Table
In this TI Nspire tutorial, the Spreadsheet window is used to create a random number table. This video supports the TI-Nspire Clickpad and Touchpad. This Mini-Tutorial Video includes a worksheet. . |
Definition--Charts and Graphs--Bar Graph |
|
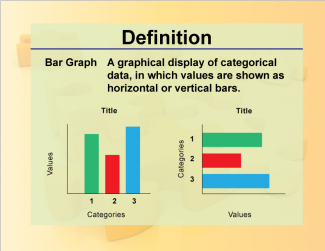
Definition--Charts and Graphs--Bar Graph
This is a collection of definitions related to the concept of charts, graphs, and data displays. |
Definition--Charts and Graphs--Box-and-Whisker Plot |
|
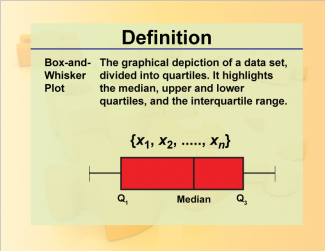
Definition--Charts and Graphs--Box-and-Whisker Plot
This is a collection of definitions related to the concept of charts, graphs, and data displays. |
Definition--Charts and Graphs--Categorical Data |
|
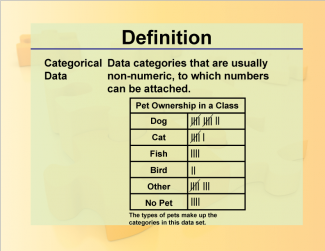
Definition--Charts and Graphs--Categorical Data
This is a collection of definitions related to the concept of charts, graphs, and data displays. |
Definition--Charts and Graphs--Circle Graph |
|
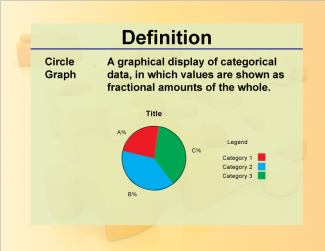
Definition--Charts and Graphs--Circle Graph
This is a collection of definitions related to the concept of charts, graphs, and data displays. |