Digital Resources on the Topic of Probability & Statistics
|
|
| Thumbnail Image | Description | |
|---|---|---|
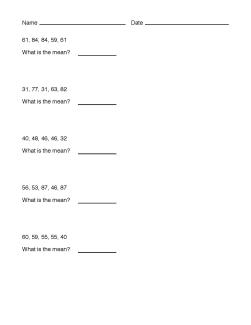
Math Worksheet Collection: Data Analysis: Mean, Median, and Mode |
|
Math Worksheet Collection: Data Analysis: Mean, Median, and Mode This collection aggregates all the math worksheets around the topic of Data Analysis: Mean, Median, and Mode. There are a total of 60 worksheets. |
Apple Harvest |

|
Description
In this module students analyze real-world data relating to apple production and consumption. Looking at global and US data, students look at measures of central tendency by analyzing a box-and-whisker plot and later normal distribution graphs. Math topics covered include: |
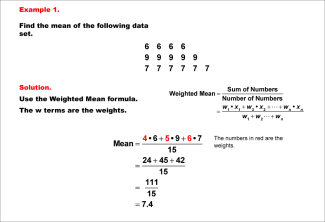
Math Examples Collection: Weighted Mean |
|
This collection aggregates all the math examples around the topic of Weighted Mean. There are a total of 9 images. |
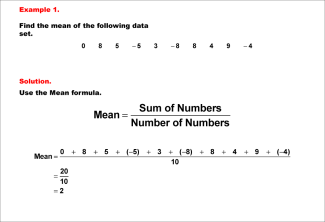
Math Examples Collection: The Mean of Data Sets with Negative Numbers |
|
OvervieThis collection aggregates all the math examples around the topic of the Mean of Data Sets with Negative Numbers. There are a total of 10 images. |
Math Video Collection: Texas Instruments Tutorial Videos |
|
Overview This colleThis collection aggregates all the math videos and resources in this series: Texas Instruments Tutorial Videos. There are a total of 266 resources. |
Math Video Collection: Video Tutorials Series: Measures of Central Tendency |
|
Overview This coThis collection aggregates all the math videos and resources in this series: Video Tutorials Series: Measures of Central Tendency. There are a total of 24 resources. |
Math Video Collection: Algebra Applications Video Series: Data Analysis |
|
OvervThis collection aggregates all the math videos and resources in this series: Algebra Applications Video Series: Data Analysis. There are a total of 26 resources. |
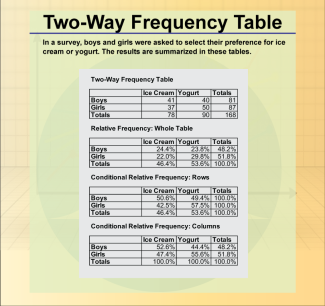
Math Clip Art Collection: Two-Way Frequency Tables |
|
This collection aggregates all the math clip art around the topic of Two-Way Frequency Tables. There are a total of 6 images. |
Math Clip Art Collection: Statistics |
|
Overview This colleThis collection aggregates all the math clip art around the topic of Statistics. There are a total of 55 images. |
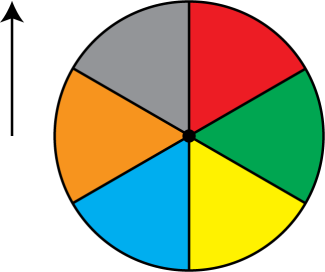
Math Clip Art Collection: Spinners |
|
OverviThis collection aggregates all the math clip art around the topic of Spinners. There are a total of 64 images. |
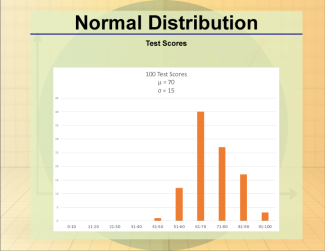
Math Clip Art Collection: Probability Distributions |
|
This collection aggregates all the math clip art around the topic of Probability Distributions. There are a total of 12 images. |
Math Clip Art Collection: Playing Cards |
|
This collection aggregates all the math clip art around the topic of Playing Cards. There are a total of 52 images. |
Math Clip Art Collection: Dice and Number Models |

|
This collection aggregates all the math clip art around the topic of Dice and Number Models. There are a total of 28 images. |
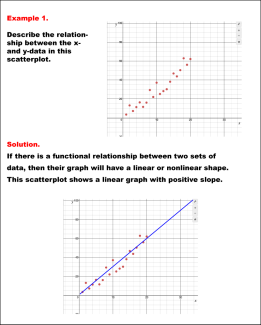
Math Examples Collection: Analyzing Scatterplots |
|
This collection aggregates all the math examples around the topic of Analyzing Scatterplots. There are a total of 10 Math Examples. |
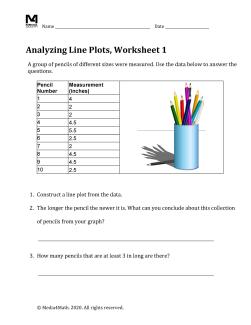
Math Worksheet Collection: Data Analysis |
|
This collection aggregates all the math worksheets around the topic of Data Analysis. There are a total of 9 worksheets. |
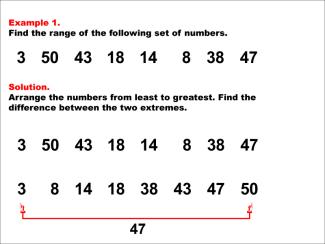
Math Examples Collection: Range |
|
Overview This collection aggregates all the math examples around the topic of Range. There are a total of 26 Math Examples. |
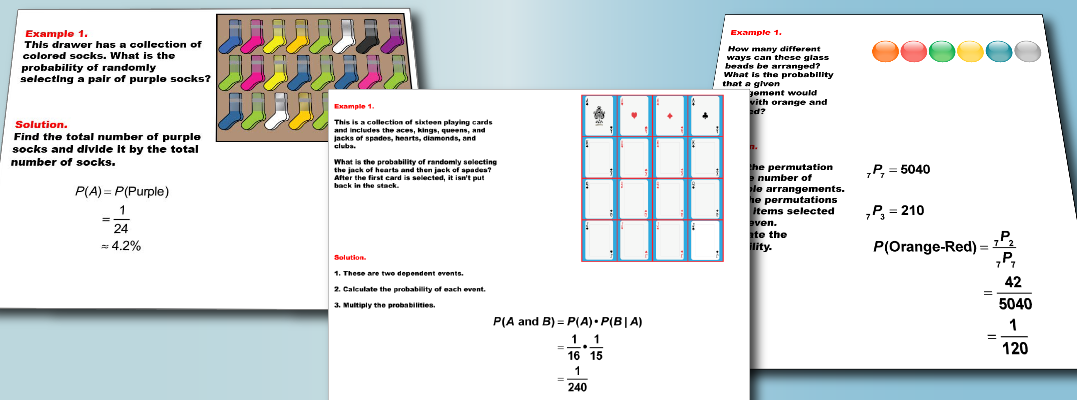
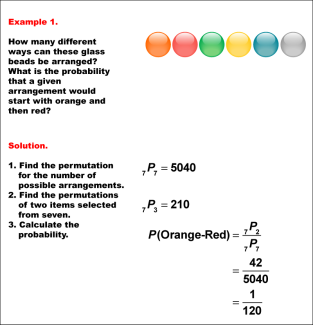
Math Examples Collection: Probability with Permutations and Combinations |
|
This collection aggregates all the math examples around the topic of Probabilities Involving Permutations and Combinations. There are a total of 6 Math Examples. |
Math Examples Collection: Probability of Conditional Events |
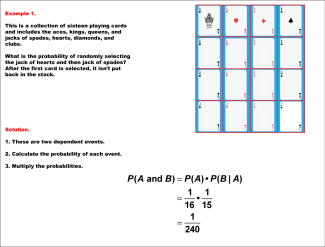
|
This collection aggregates all the math examples around the topic of the Probability of Conditional Events. There are a total of 6 Math Examples. |
Math Examples Collection: Probability |
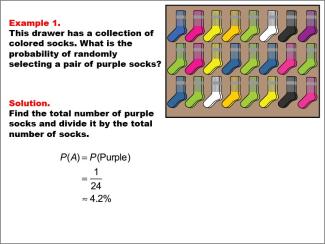
|
Overview This collection aggregates all the math examples around the topic of Probability. There are a total of 28 Math Examples. |
Math Examples Collection: The Mode |
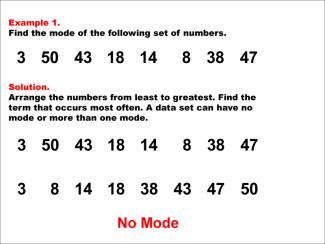
|
Overview This collection aggregates all the math examples around the topic of the Mode. There are a total of 78 Math Examples. |
Math Examples Collection: The Median |
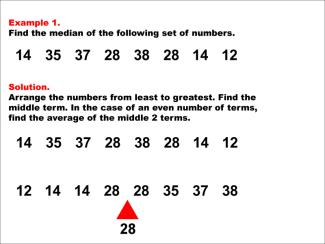
|
Overview This collection aggregates all the math examples around the topic of the Median. There are a total of 40 Math Examples. |
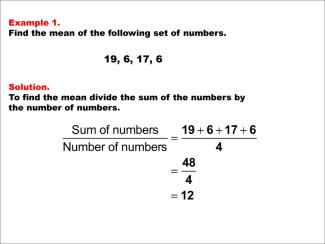
Math Examples Collection: The Mean |
|
OverviewThis collection aggregates all the math examples around the topic of the Mean. There are a total of 42 Math Examples. |
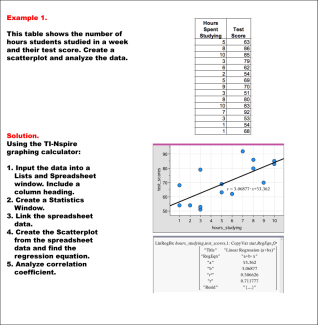
Math Examples Collection: Linear Data Models |
|
Overview This collThis collection aggregates all the math examples around the topic of Linear Data Models. There are a total of 4 Math Examples. |
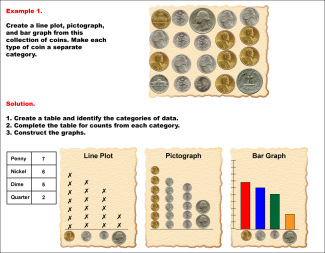
Math Examples Collection: Graphs From Categorical Data |
|
OverviewThis collection aggregates all the math examples around the topic of Graphs of Categorical Data. There are a total of 6 Math Examples. |
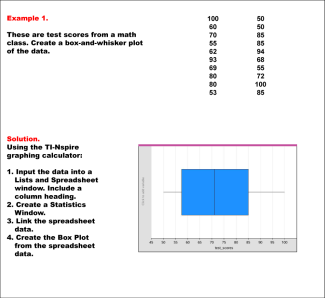
Math Examples Collection: Data Plots |
|
Overview This collection aggregates all the math examples around the topic of Data Plots. There are a total of 4 Math Examples. |