
These are the resources that support this NYS Standard.
NY-6.SP.4: Display numerical data in plots on a number line, including dot plots, histograms, and box plots.
There are 403 resources.| Title | Description | Thumbnail Image | Curriculum Topics |
|---|---|---|---|
Halloween Math Collection |
This is a collection of Halloween-themed math clip art and other resources. There are more than 40 resources. | 
|
3-Dimensional Figures, Applications of 3D Geometry, Numerical Expressions, Even and Odd Numbers, Ratios and Rates, Counting, Data Analysis and Divide by 1-Digit Numbers |
Math in the News Collection: Business Math |
OverviewThis is a collection of issues of Math in the News that deal with business applications. | 
|
Applications of Exponential and Logarithmic Functions, Data Analysis and Volume |
Math in the News Collection: Applications of Data Analysis |
This is a collection of Math in the News stories that focus on the topic of Data Analysis. | 
|
Data Analysis, Data Gathering, Probability, Percents and Ratios and Rates |
Math in the News Collection: Applications of Exponential Functions |
OverThis is a collection of Math in the News stories that focus on the topic of Exponential Functions. | 
|
Applications of Exponential and Logarithmic Functions, Applications of Linear Functions, Data Analysis and Sequences |
Math Video Collection: Texas Instruments Tutorial Videos |
Overview This colleThis collection aggregates all the math videos and resources in this series: Texas Instruments Tutorial Videos. There are a total of 266 resources. | 
|
Rational Expressions, Sequences, Series, Polynomial Functions and Equations, Graphs of Quadratic Functions, Quadratic Equations and Functions, Solving Systems of Equations, Trig Expressions and Identities, Probability, Geometric Constructions with Triangles, Composite Functions, Geometric Constructions with Angles and Planes, Distance Formula, Data Analysis, Slope, Special Functions, Trigonometric Functions, Graphs of Exponential and Logarithmic Functions, Radical Functions and Equations, Rational Functions and Equations, Slope-Intercept Form, Coordinate Systems, Graphs of Linear Functions, Inequalities, Matrix Operations and Midpoint Formula |
Math Worksheet Collection: Data Analysis: Mean, Median, and Mode |
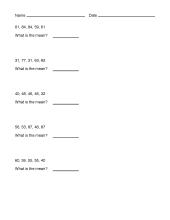
Math Worksheet Collection: Data Analysis: Mean, Median, and Mode This collection aggregates all the math worksheets around the topic of Data Analysis: Mean, Median, and Mode. There are a total of 60 worksheets. |
|
Data Analysis |
Math Examples Collection: Range |
Overview This collection aggregates all the math examples around the topic of Range. There are a total of 26 Math Examples. | 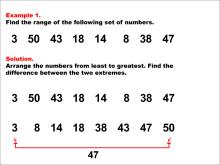
|
Data Analysis |
Math Examples Collection: The Mode |
Overview This collection aggregates all the math examples around the topic of the Mode. There are a total of 78 Math Examples. | 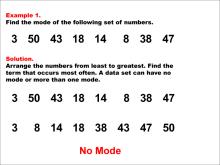
|
Data Analysis |
Math Examples Collection: The Median |
Overview This collection aggregates all the math examples around the topic of the Median. There are a total of 40 Math Examples. | 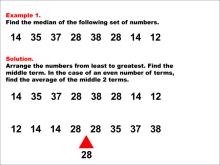
|
Data Analysis |
Math Examples Collection: The Mean |
OverviewThis collection aggregates all the math examples around the topic of the Mean. There are a total of 42 Math Examples. | 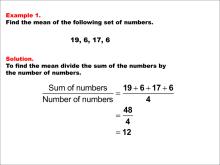
|
Data Analysis |
Math Definitions Collection: Sequences and Series |
This collection aggregates all the definition image cards around the topic of Sequences and Series vocabulary. There are a total of 25 terms. | 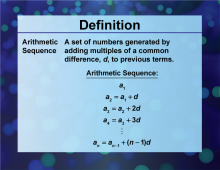
|
Sequences and Series |
Instructional Resource Collection: The Fibonacci Sequence |
This is a collection of lessons on the Fibonacci Sequence. There are six lessons. | 
|
Sequences, Exploring Coordinate Systems, Applications of Exponential and Logarithmic Functions, Ratios and Rates, Proportions, Geometric Constructions with Triangles and Applications of Quadrilaterals |
Quizlet Flash Card Collection: Measures of Central Tendency |
This is a collection of Quizlet Flash Cards on the topic of Measures of Central Tendency. There are a total of 20 Quizlet Flash Card sets. | 
|
Data Analysis |
Math Definitions Collection: Statistics and Probability |
This collection aggregates all the definition image cards around the topic of Statistics and Probability terms and vocabulary. There are a total of 34 terms. | 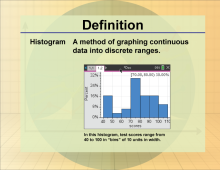
|
Data Analysis, Probability and Data Gathering |
Closed Captioned Video: Box-and-Whisker Plot |
Closed Captioned Video: Box-and-Whisker Plot
In this TI Nspire tutorial the Spreadsheet and Statistics windows are used to create a box-and-whisker plot. This video supports the TI-Nspire Clickpad and Touchpad. This Mini-Tutorial Video includes a worksheet. . |
|
Data Analysis |
Closed Captioned Video: Multiseries Scatterplot |
Closed Captioned Video: Multiseries Scatterplot
In this TI Nspire tutorial, Spreadsheet and Graph windows are used to graph a multiseries scatterplot. This video supports the TI-Nspire Clickpad and Touchpad. This Mini-Tutorial Video includes a worksheet. |
|
Data Analysis |
Closed Captioned Video: Scatterplot 1 |
Closed Captioned Video: Scatterplot 1
In this TI Nspire tutorial, Spreadsheet and Graph windows are used to graph a scatterplot. This video supports the TI-Nspire Clickpad and Touchpad. This Mini-Tutorial Video includes a worksheet. |
|
Data Analysis |
Closed Captioned Video: Scatterplot 2 |
Closed Captioned Video: Scatterplot 2
In this TI Nspire tutorial, Spreadsheet and Statistics windows are used to graph a scatterplot. This video supports the TI-Nspire Clickpad and Touchpad. This Mini-Tutorial Video includes a worksheet. |
|
Data Analysis |
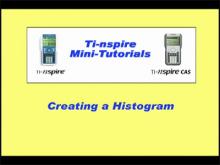
Closed Captioned Video: Creating a Histogram |
Closed Captioned Video: Creating a Histogram
In this TI Nspire tutorial, the Spreadsheet and Statistics windows are used to create a histogram. This video supports the TI-Nspire Clickpad and Touchpad. This Mini-Tutorial Video includes a worksheet. . |
|
Data Analysis |
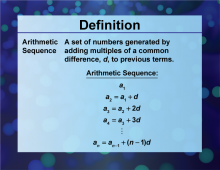
Definition--Sequences and Series Concepts--Arithmetic Sequence |
Definition | Sequences and Series Concepts | Arithmetic Sequence
This is part of a collection of definitions related to sequences, series, and related topics. This includes general definitions for sequences and series, as well as definitions of specific types of sequences and series, as well as their properties. |
|
Sequences |
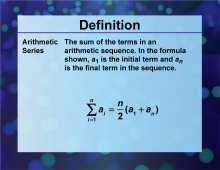
Definition--Sequences and Series Concepts--Arithmetic Series |
Definition--Sequences and Series Concepts--Arithmetic Series
This is part of a collection of definitions related to sequences, series, and related topics. This includes general definitions for sequences and series, as well as definitions of specific types of sequences and series, as well as their properties. |
|
Series |
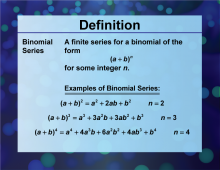
Definition--Sequences and Series Concepts--Binomial Series |
Definition--Sequences and Series Concepts--Binomial Series
This is part of a collection of definitions related to sequences, series, and related topics. This includes general definitions for sequences and series, as well as definitions of specific types of sequences and series, as well as their properties. |
|
Series |
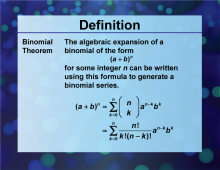
Definition--Sequences and Series Concepts--Binomial Theorem |
Definition--Sequences and Series Concepts--Binomial Theorem
This is part of a collection of definitions related to sequences, series, and related topics. This includes general definitions for sequences and series, as well as definitions of specific types of sequences and series, as well as their properties. |
|
Series |
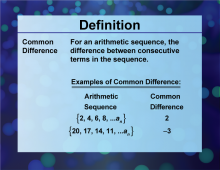
Definition--Sequences and Series Concepts--Common Difference |
Definition--Sequences and Series Concepts--Common Difference
This is part of a collection of definitions related to sequences, series, and related topics. This includes general definitions for sequences and series, as well as definitions of specific types of sequences and series, as well as their properties. |
|
Sequences |
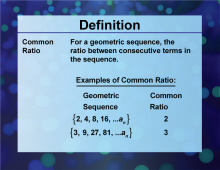
Definition--Sequences and Series Concepts--Common Ratio |
Definition--Sequences and Series Concepts--Common Ratio
This is part of a collection of definitions related to sequences, series, and related topics. This includes general definitions for sequences and series, as well as definitions of specific types of sequences and series, as well as their properties. |
|
Sequences |

