
These are the resources that support this TEKS Standard.
TEKS.6.12b - Use the graphical representation of numeric data to describe the center, spread, and shape of the data distribution.
Displaying 1 - 50 of 217 resources:
| Thumbnail Image | Title | Description | Curriculum Nodes |
|---|---|---|---|
|
Closed Captioned Video: Box-and-Whisker Plot |
Closed Captioned Video: Box-and-Whisker Plot
In this TI Nspire tutorial the Spreadsheet and Statistics windows are used to create a box-and-whisker plot. |
Data Analysis |
|
Closed Captioned Video: Multiseries Scatterplot |
Closed Captioned Video: Multiseries Scatterplot
In this TI Nspire tutorial, Spreadsheet and Graph windows are used to graph a multiseries scatterplot. This video supports the TI-Nspire Clickpad and Touchpad. |
Data Analysis |
|
Closed Captioned Video: Scatterplot 1 |
Closed Captioned Video: Scatterplot 1
In this TI Nspire tutorial, Spreadsheet and Graph windows are used to graph a scatterplot. This video supports the TI-Nspire Clickpad and Touchpad. |
Data Analysis |
|
Closed Captioned Video: Scatterplot 2 |
Closed Captioned Video: Scatterplot 2
In this TI Nspire tutorial, Spreadsheet and Statistics windows are used to graph a scatterplot. This video supports the TI-Nspire Clickpad and Touchpad. |
Data Analysis |
|
Closed Captioned Video: A Probability Simulation 2 |
Closed Captioned Video: A Probability Simulation 2
In this TI Nspire tutorial, the Spreadsheet and Statistics windows are used to create a probability simulation of a coin toss. |
Probability |
|
Closed Captioned Video: A Probability Simulation 3 |
Closed Captioned Video: A Probability Simulation 3
In this TI Nspire tutorial, the Spreadsheet and Statistics windows are used to create a probability simulation of tossing two coins. |
Probability |
|
Closed Captioned Video: Creating a Histogram |
Closed Captioned Video: Creating a Histogram
In this TI Nspire tutorial, the Spreadsheet and Statistics windows are used to create a histogram. This video supports the TI-Nspire Clickpad and Touchpad. |
Data Analysis |
|
Closed Captioned Video: Mean of a Data List |
Closed Captioned Video: Mean of a Data List
In this TI Nspire tutorial, the Spreadsheet and Calculator windows are used to find the mean of a data list. |
Data Analysis |

|
Closed Captioned Video: Measures of Central Tendency: Finding the Mean of a Data Set I |
Closed Captioned Video: Measures of Central Tendency: Finding the Mean of a Data Set I
In this video tutorial students learn how to calculate the mean when all of the data items are positive numbers. |
Data Analysis and Data Gathering |
|
Closed Captioned Video: Measures of Central Tendency: Finding the Mean of a Data Set II |
Closed Captioned Video: Measures of Central Tendency: Finding the Mean of a Data Set II
In this video tutorial students learn how to calculate the mean when some of the data items are negative numbers. |
Data Analysis and Data Gathering |

|
Closed Captioned Video: Measures of Central Tendency: Finding the Median of a Data Set |
Closed Captioned Video: Measures of Central Tendency: Finding the Median of a Data Set
In this video tutorial students learn how to find the median of a data set. |
Data Analysis and Data Gathering |
|
Closed Captioned Video: Measures of Central Tendency: Sample Mean |
Closed Captioned Video: Measures of Central Tendency: Sample Mean
In this video tutorial students learn about sample mean from a random sampling of data. |
Data Analysis and Data Gathering |
|
Closed Captioned Video: Measures of Central Tendency: The Mean and Normally Distributed Data |
Closed Captioned Video: Measures of Central Tendency: The Mean and Normally Distributed Data
In this video tutorial students learn about normally distributed data and how to identify the population mean from |
Data Analysis and Data Gathering |
|
Closed Captioned Video: Median of a Data List |
Closed Captioned Video: Median of a Data List
In this TI Nspire tutorial, the Spreadsheet and Calculator windows are used to find the median of a data list. |
Data Analysis |
|
Closed Captioned Video: Probability Simulation 1 |
Closed Captioned Video: Probability Simulation 1
In this TI Nspire tutorialthe Spreadsheet and Statistics windows are used to create a probability simulation of tossing two dice. |
Probability |
|
Closed Captioned Video: Random Number Table |
Closed Captioned Video: Random Number Table
In this TI Nspire tutorial, the Spreadsheet window is used to create a random number table. This video supports the TI-Nspire Clickpad and Touchpad. |
Probability |
|
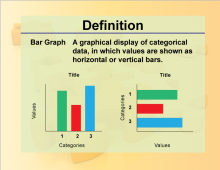
Definition--Charts and Graphs--Bar Graph |
Definition--Charts and Graphs--Bar Graph
This is a collection of definitions related to the concept of charts, graphs, and data displays. |
Data Analysis |
|
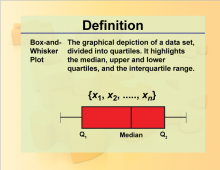
Definition--Charts and Graphs--Box-and-Whisker Plot |
Definition--Charts and Graphs--Box-and-Whisker Plot
This is a collection of definitions related to the concept of charts, graphs, and data displays. |
Data Analysis |
|
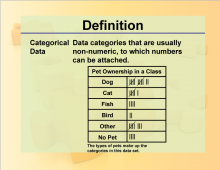
Definition--Charts and Graphs--Categorical Data |
Definition--Charts and Graphs--Categorical Data
This is a collection of definitions related to the concept of charts, graphs, and data displays. |
Data Analysis |
|
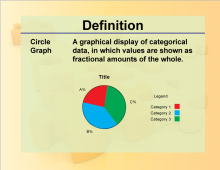
Definition--Charts and Graphs--Circle Graph |
Definition--Charts and Graphs--Circle Graph
This is a collection of definitions related to the concept of charts, graphs, and data displays. |
Data Analysis |
|
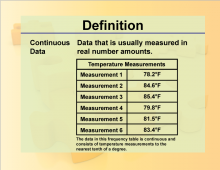
Definition--Charts and Graphs--Continuous Data |
Definition--Charts and Graphs--Continuous Data
This is a collection of definitions related to the concept of charts, graphs, and data displays. |
Data Analysis |
|
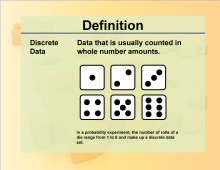
Definition--Charts and Graphs--Discrete Data |
Definition--Charts and Graphs--Discrete Data
This is a collection of definitions related to the concept of charts, graphs, and data displays. |
Data Analysis |
|
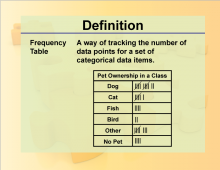
Definition--Charts and Graphs--Frequency Table |
Definition--Charts and Graphs--Frequency Table
This is a collection of definitions related to the concept of charts, graphs, and data displays. |
Data Analysis |
|
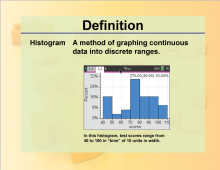
Definition--Charts and Graphs--Histogram |
Definition--Charts and Graphs--Histogram
This is a collection of definitions related to the concept of charts, graphs, and data displays. |
Data Analysis |
|
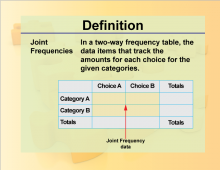
Definition--Charts and Graphs--Joint Frequencies |
Definition--Charts and Graphs--Joint Frequencies
This is a collection of definitions related to the concept of charts, graphs, and data displays. |
Data Analysis |
|
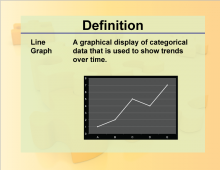
Definition--Charts and Graphs--Line Graph |
Definition--Charts and Graphs--Line Graph
This is a collection of definitions related to the concept of charts, graphs, and data displays. |
Data Analysis |
|
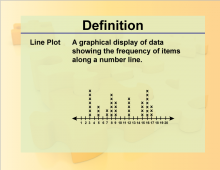
Definition--Charts and Graphs--Line Plot |
Definition--Charts and Graphs--Line Plot
This is a collection of definitions related to the concept of charts, graphs, and data displays. |
Data Analysis |
|
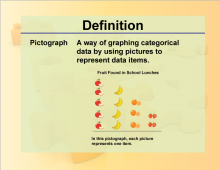
Definition--Charts and Graphs--Pictograph |
Definition--Charts and Graphs--Pictograph
This is a collection of definitions related to the concept of charts, graphs, and data displays. |
Data Analysis |
|
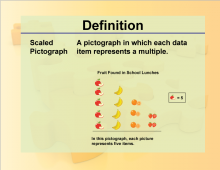
Definition--Charts and Graphs--Scaled Pictograph |
Definition--Charts and Graphs--Scaled Pictograph
This is a collection of definitions related to the concept of charts, graphs, and data displays. |
Data Analysis |
|
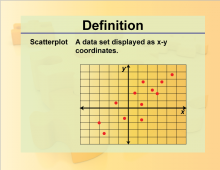
Definition--Charts and Graphs--Scatterplot |
Definition--Charts and Graphs--Scatterplot
This is a collection of definitions related to the concept of charts, graphs, and data displays. |
Data Analysis |
|
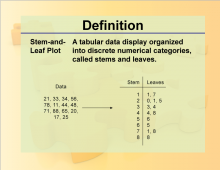
Definition--Charts and Graphs--Stem-and-Leaf Plot |
Definition--Charts and Graphs--Stem-and-Leaf Plot
This is a collection of definitions related to the concept of charts, graphs, and data displays. |
Data Analysis |
|
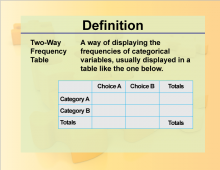
Definition--Charts and Graphs--Two-Way Frequency Table |
Definition--Charts and Graphs--Two-Way Frequency Table
This is a collection of definitions related to the concept of charts, graphs, and data displays. |
Data Analysis |
|
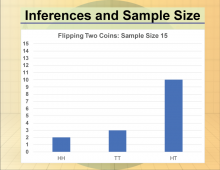
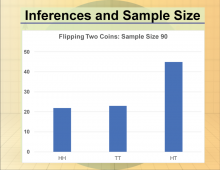
Math Clip Art--Statistics and Probability-- Inferences and Sample Size--10 |
Math Clip Art--Statistics and Probability-- Inferences and Sample Size--10
This is part of a collection of math clip art images that show different statistical graphs and concepts, along with some probability |
Data Gathering |
|
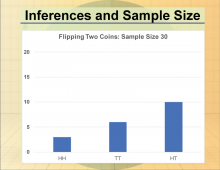
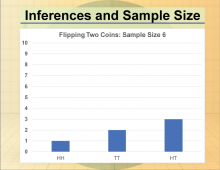
Math Clip Art--Statistics and Probability-- Inferences and Sample Size--11 |
Math Clip Art--Statistics and Probability-- Inferences and Sample Size--11
This is part of a collection of math clip art images that show different statistical graphs and concepts, along with some probability |
Data Gathering |
|
Math Clip Art--Statistics and Probability-- Inferences and Sample Size--12 |
Math Clip Art--Statistics and Probability-- Inferences and Sample Size--12
This is part of a collection of math clip art images that show different statistical graphs and concepts, along with some probability |
Data Gathering |
|
Math Clip Art--Statistics and Probability-- Inferences and Sample Size--9 |
Math Clip Art--Statistics and Probability-- Inferences and Sample Size--9
This is part of a collection of math clip art images that show different statistical graphs and concepts, along with some probability |
Data Gathering |
|
Math Clip Art--Statistics and Probability-- Statistical Variability--10 |
Math Clip Art--Statistics and Probability-- Statistical Variability--10
This is part of a collection of math clip art images that show different statistical graphs and concepts, along with some probability co |
Data Gathering |
|
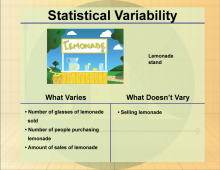
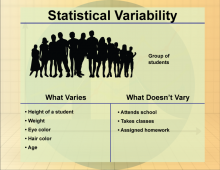
Math Clip Art--Statistics and Probability-- Statistical Variability--5 |
Math Clip Art--Statistics and Probability-- Statistical Variability--5
This is part of a collection of math clip art images that show different statistical graphs and concepts, along with some probability con |
Data Gathering |
|
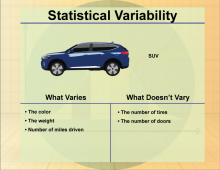
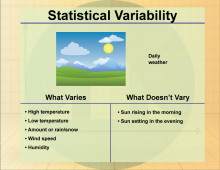
Math Clip Art--Statistics and Probability-- Statistical Variability--6 |
Math Clip Art--Statistics and Probability-- Statistical Variability--6
This is part of a collection of math clip art images that show different statistical graphs and concepts, along with some probability con |
Data Gathering |
|
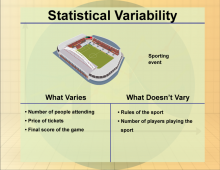
Math Clip Art--Statistics and Probability-- Statistical Variability--7 |
Math Clip Art--Statistics and Probability-- Statistical Variability--7
This is part of a collection of math clip art images that show different statistical graphs and concepts, along with some probability con |
Data Gathering |
|
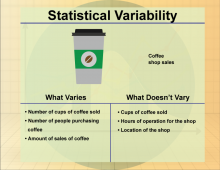
Math Clip Art--Statistics and Probability-- Statistical Variability--8 |
Math Clip Art--Statistics and Probability-- Statistical Variability--8
This is part of a collection of math clip art images that show different statistical graphs and concepts, along with some probability con |
Data Gathering |
|
Math Clip Art--Statistics and Probability-- Statistical Variability--9 |
Math Clip Art--Statistics and Probability-- Statistical Variability--9
This is part of a collection of math clip art images that show different statistical graphs and concepts, along with some probability con |
Data Gathering |

|
Math Clip Art--Statistics and Probability--Basic Line Plot |
Math Clip Art--Statistics and Probability--Basic Line Plot
This is part of a collection of math clip art images that show different statistical graphs and concepts, along with some probability concepts. |
Length |
|
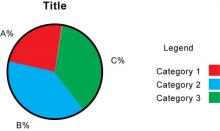
Math Clip Art--Statistics and Probability--Circle Graph |
Math Clip Art--Statistics and Probability--Circle Graph
This is part of a collection of math clip art images that show different statistical graphs and concepts, along with some probability concepts. |
Data Analysis |
|
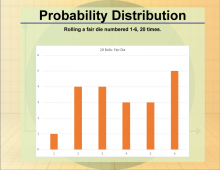
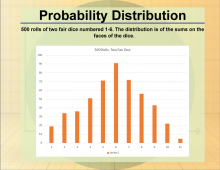
Math Clip Art--Statistics and Probability--Probability Distribution--1 |
Math Clip Art--Statistics and Probability--Probability Distribution--1
This is part of a collection of math clip art images that show different statistical graphs and concepts, along with some probability con |
Probability |
|
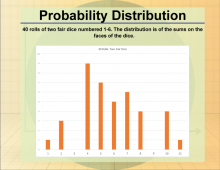
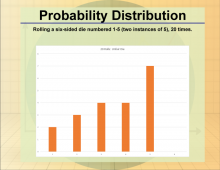
Math Clip Art--Statistics and Probability--Probability Distribution--10 |
Math Clip Art--Statistics and Probability--Probability Distribution--10
This is part of a collection of math clip art images that show different statistical graphs and concepts, along with some probability co |
Probability |
|
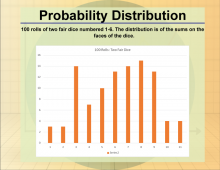
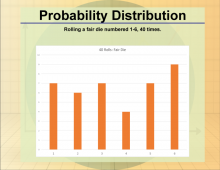
Math Clip Art--Statistics and Probability--Probability Distribution--11 |
Math Clip Art--Statistics and Probability--Probability Distribution--11
This is part of a collection of math clip art images that show different statistical graphs and concepts, along with some probability co |
Probability |
|
Math Clip Art--Statistics and Probability--Probability Distribution--12 |
Math Clip Art--Statistics and Probability--Probability Distribution--12
This is part of a collection of math clip art images that show different statistical graphs and concepts, along with some probability co |
Probability |
|
Math Clip Art--Statistics and Probability--Probability Distribution--2 |
Math Clip Art--Statistics and Probability--Probability Distribution--2
This is part of a collection of math clip art images that show different statistical graphs and concepts, along with some probability con |
Probability |
|
Math Clip Art--Statistics and Probability--Probability Distribution--3 |
Math Clip Art--Statistics and Probability--Probability Distribution--3
This is part of a collection of math clip art images that show different statistical graphs and concepts, along with some probability con |
Probability |