Math in the News Collection: Applications of Exponential Functions
 |
OverviewThis is a collection of Math in the News stories that focus on the topic of Exponential Functions.
|
|
OverviewThis is a collection of Math in the News stories that focus on the topic of Exponential Functions.
|
 |
OverviewThis is a collection of Math in the News stories that focus on the topic of Data Analysis.
|
Math Worksheet Collection: Data Analysis: Mean, Median, and Mode
 |
OverviewThis collection aggregates all the math worksheets around the topic of Data Analysis: Mean, Median, and Mode. There are a total of 60 worksheets. Each worksheet includes an answer key. This collection of resources is made up of downloadable PDF files that you can easily incorporate into your instruction.
To download the full set of these resources, click on this link.
|
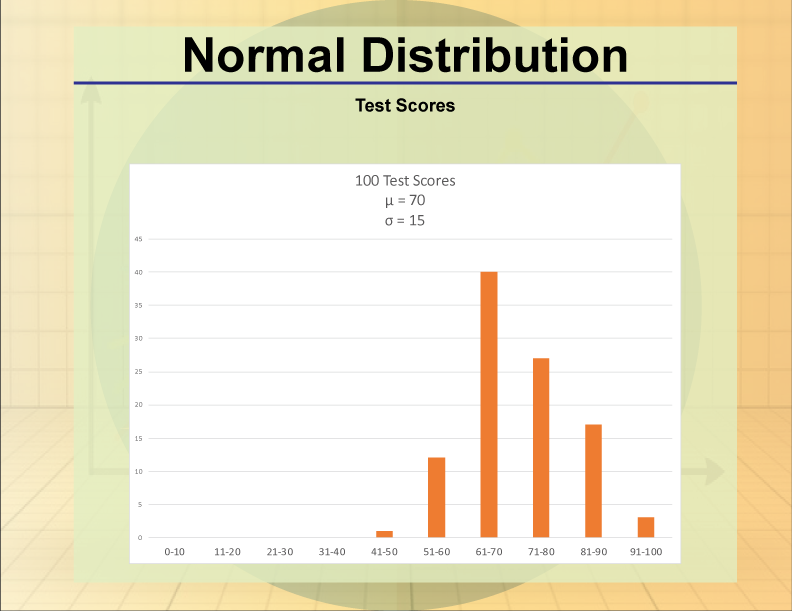 |
OverviewThis collection aggregates all the math clip art around the topic of Probability Distributions. There are a total of 12 images. This collection of resources is made up of downloadable PNG files that you can easily incorporate into a presentation.
To download the full set of these resources, click on this link.
|
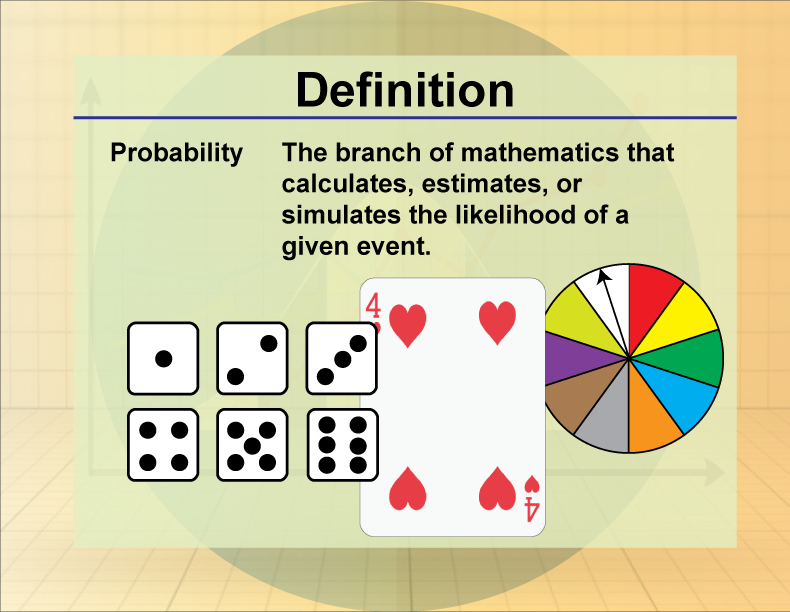 | OverviewThe collection of definitions on the topic of Probability and Statistics from Media4Math is a valuable educational resource designed to enhance students' understanding of key concepts in this field. This collection includes essential terms such as statistic, probability, probability distribution, among others. Each definition is crafted to provide clarity and support students in grasping complex statistical ideas. Understanding these terms is crucial as they form the foundation for analyzing data and making informed decisions based on statistical evidence. By familiarizing themselves with these definitions, students can better comprehend how data is collected, analyzed, and interpreted in real-world scenarios. For instance, the collection includes practical examples that illustrate how probability and statistics are applied in everyday situations, such as predicting weather patterns or analyzing market trends. The use of definition cards in presentations can greatly benefit students by providing visual and textual reinforcement of these concepts. Educators can leverage these resources to create engaging and informative lessons, making abstract ideas more accessible. Subscribers to Media4Math have the added advantage of using the Slide Show Creator to tailor presentations to their specific teaching needs, further enhancing the learning experience. For more information, visit the Slide Show Creator at https://www.media4math.com/SlideShowCreator. |
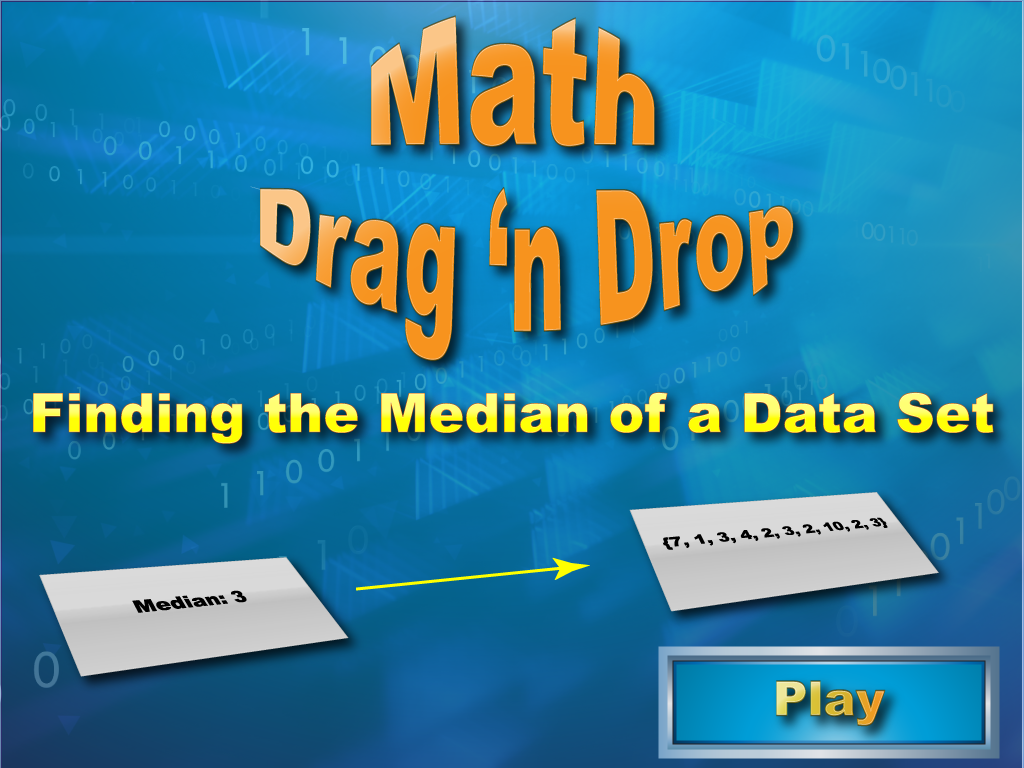 | OverviewThis is a collection of all our drag-n-drop math games. There are a total of 34 games. These games cover a variety of different skills. Each comes with a large bank of questions, so each game experience will be different. These games are ideal for practice and review.
|
 | OverviewThis collection of math clip art on Dice and Domino Number Models offers a versatile set of 28 high-quality PNG images designed to enhance mathematical instruction. The collection provides educators with visually appealing resources to introduce and reinforce concepts related to probability, counting, and number representation. Using these images, teachers can effectively demonstrate various mathematical skills, including:
The sequence of images serves as an excellent tool for introducing the topic of Dice and Domino Number Models, allowing students to visualize abstract concepts concretely. Math clip art proves invaluable for instructional purposes, as it engages visual learners and helps break down complex ideas into easily digestible visual representations. Subscribers to Media4Math can take full advantage of these resources by utilizing the Slide Show Creator (https://www.media4math.com/SlideShowCreator) to craft customized presentations. This feature empowers educators to create tailored lessons that incorporate these dice and domino images, ensuring a more interactive and engaging learning experience for students. By leveraging this collection, teachers can create dynamic, visually-rich lessons that captivate students' attention and promote a deeper understanding of mathematical concepts related to dice and domino number models. |
 | OverviewThis collection aggregates all the math clip art around the topic of Playing Cards. There are a total of 52 images. This collection of resources is made up of downloadable PNG files that you can easily incorporate into a presentation. |