Display Title
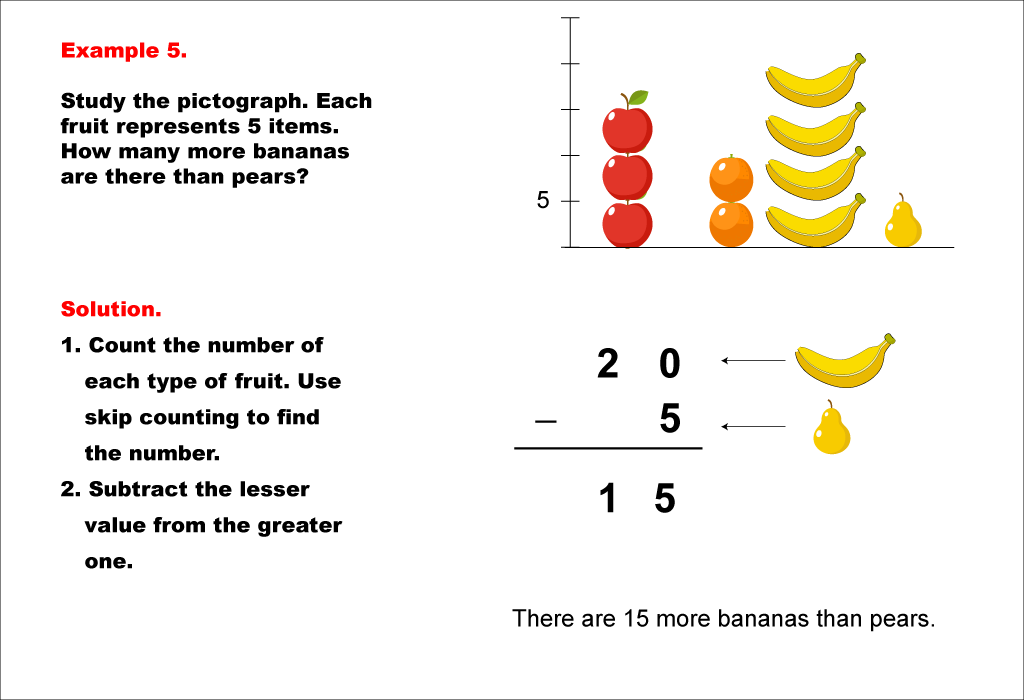
Math Example--Charts, Graphs, and Plots-- Reading and Interpreting Scaled Graphs--Example 5
Display Title
Math Example--Charts, Graphs, and Plots-- Reading and Interpreting Scaled Graphs--Example 5
Math Example--Charts, Graphs, and Plots-- Reading and Interpreting Scaled Graphs--Example 5
In this set of math examples, analyze the behavior of different scatterplots. This includes linear and quadratic models.
To see the complete math example collection on this topic, click on this link
Note: The download is an image file.
Related Resources
To see additional resources on this topic, click on the Related Resources tab.
Create a Slide Show
Subscribers can use Slide Show Creator to create a slide show from the complete collection of math examples on this topic. To learn more about Slide Show Creator, click on this Link:
Accessibility
This resource can also be used with a screen reader. Follow these steps.
-
Click on the Accessibility icon on the upper-right part of the screen.

-
From the menu, click on the Screen Reader button. Then close the Accessibility menu.

-
Click on the PREVIEW button on the left and then click on the definition card. The Screen Reader will read the definition.
| Common Core Standards | CCSS.MATH.CONTENT.3.MD.B.3 |
|---|---|
| Grade Range | 3 - 5 |
| Curriculum Nodes |
Arithmetic • Subtraction • Subtraction Facts to 100 Algebra • Probability and Data Analysis • Data Analysis |
| Copyright Year | 2021 |
| Keywords | data analysis, bar graph, statistics, line plot, pictograph |