Display Title
Math Clip Art--Statistics--Inferences and Sample Size--04
Display Title
Math Clip Art--Statistics--Inferences and Sample Size--04
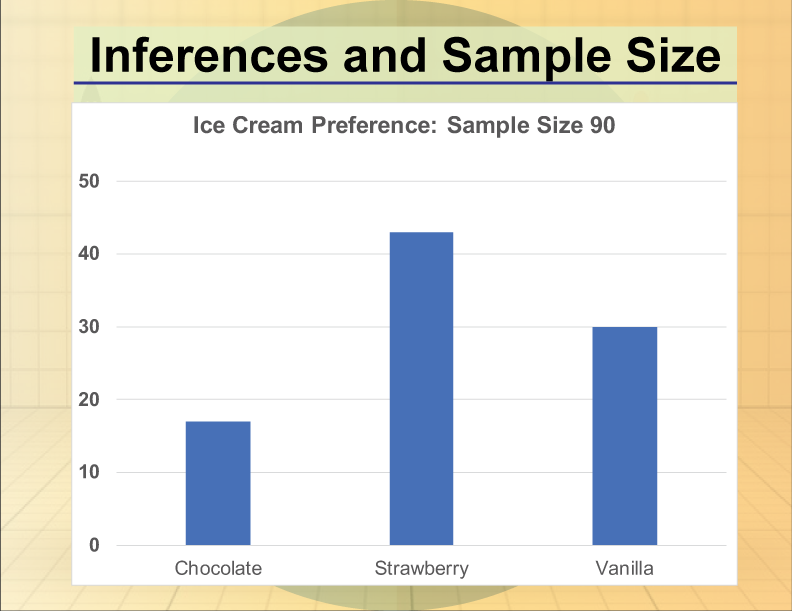
Math Clip Art--Statistics--Inferences and Sample Size--04
This is part of a collection of math clip art images that show different statistical graphs and concepts, along with some probability concepts.
Note: The download is a GIF file.
Related Resources
To see additional resources on this topic, click on the Related Resources tab.
Create a Slide Show
Subscribers can use Slide Show Creator to create a slide show from the complete collection of math clip art on this topic. To see the complete clip art collection, click on this link.
To learn more about Slide Show Creator, click on this Link:
Accessibility
This resource can also be used with a screen reader. Follow these steps.
-
Click on the Accessibility icon on the upper-right part of the screen.

-
From the menu, click on the Screen Reader button. Then close the Accessibility menu.

-
Click on the PREVIEW button on the left and then click on the definition card. The Screen Reader will read the definition.
| Common Core Standards | CCSS.MATH.CONTENT.6.SP.B.5.A, CCSS.MATH.CONTENT.6.SP.B.5.B, CCSS.MATH.CONTENT.6.SP.B.5.D, CCSS.MATH.CONTENT.7.SP.A.1, CCSS.MATH.CONTENT.7.SP.A.2, CCSS.MATH.CONTENT.7.SP.B.3, CCSS.MATH.CONTENT.7.SP.B.4, CCSS.MATH.CONTENT.8.SP.A.4 |
|---|---|
| Grade Range | 6 - 10 |
| Curriculum Nodes |
Algebra • Probability and Data Analysis • Data Gathering |
| Copyright Year | 2020 |
| Keywords | sample size, Statistical inference |