Skip to content

Media4Math Library

  • Home
  • Search
  • Subscribe
  • Content
    Newest Resources Free Resources Content Showcase Review Topics SAT Test Prep Blog Training Videos
  • Standards
    CCSS Standards (K-12) TEKS (K-5) TEKS (6-12) NYS (K-5) NYS (6-8) NYS (9-12) FL (K-5) FL (6-8) FL (9-12)
  • Getting Started
    Educators Tutors Parents
  • Funding
    Donors Choose
  • Partners
  • Classroom
  • Log in

Clock Clip Art


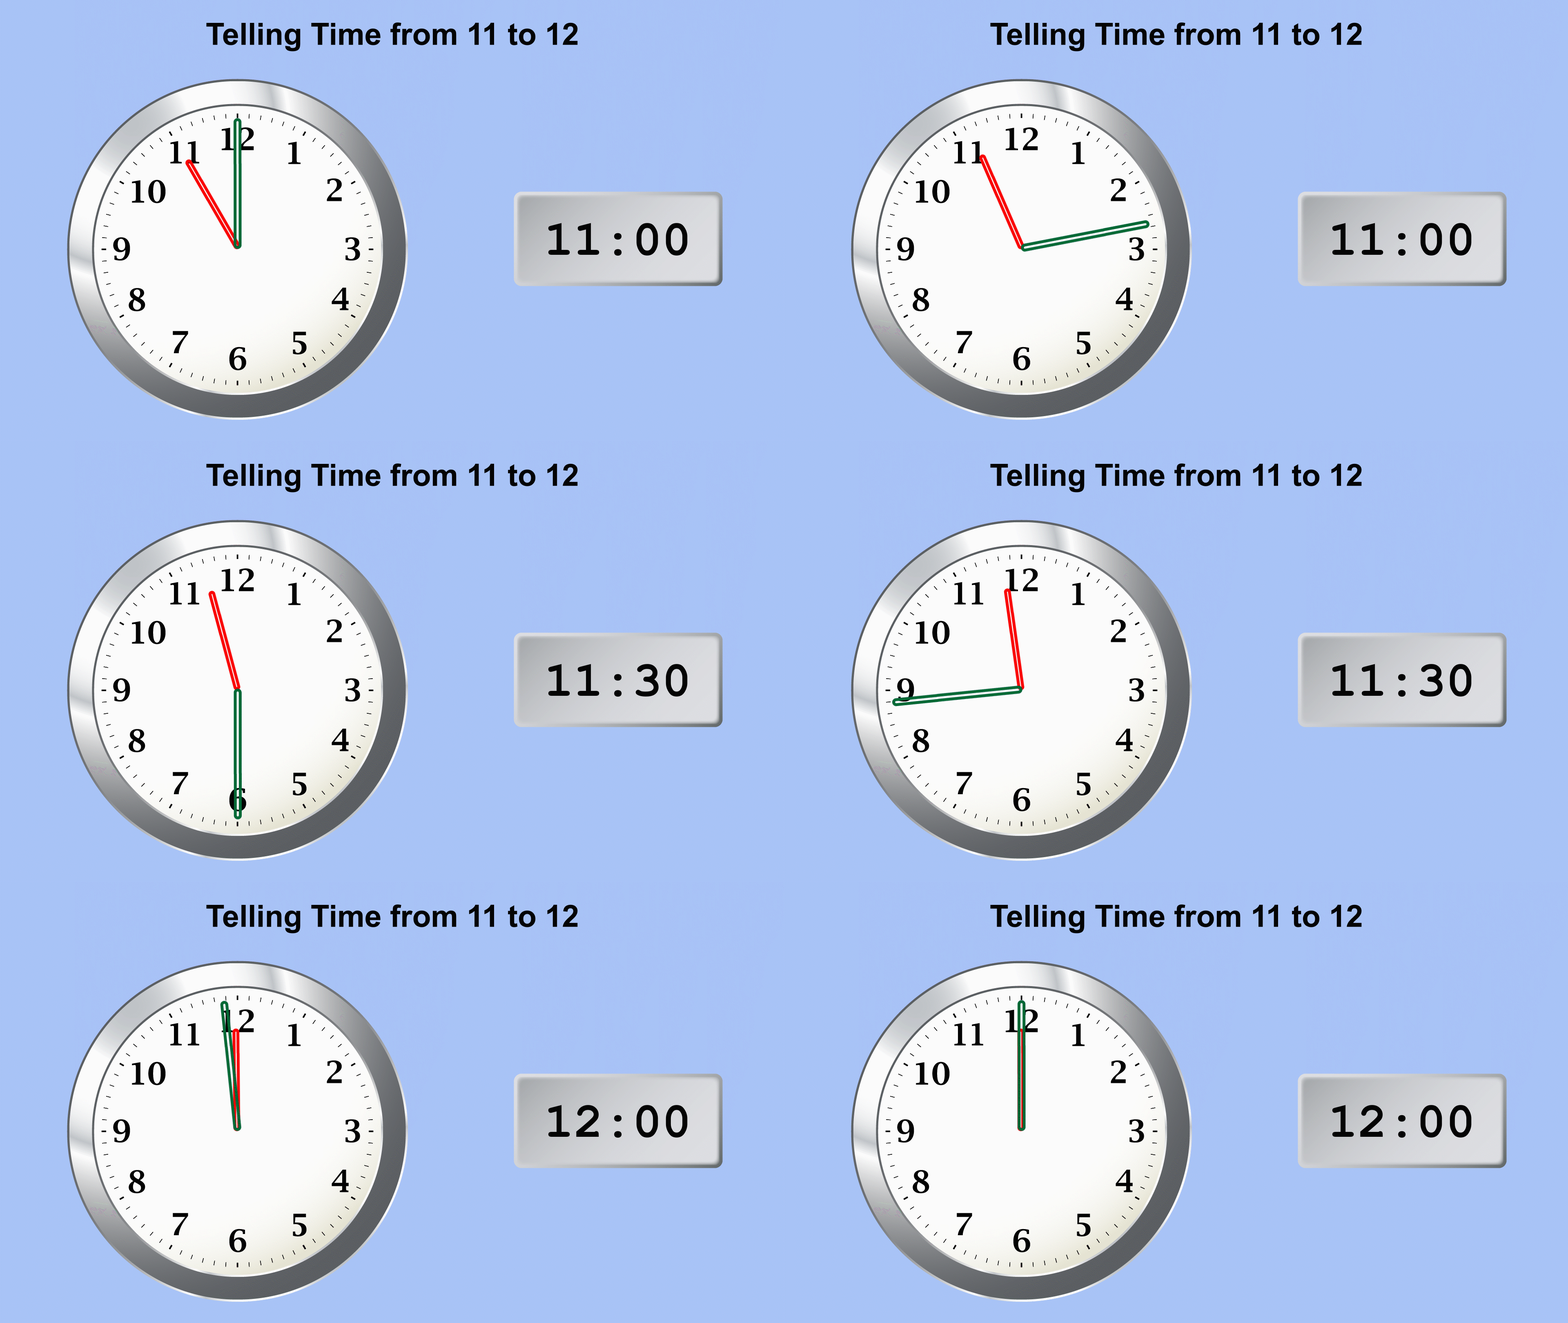
Animated Math Clip Art--Clock Faces--From 11 to 12
Register to SaveSubscribe to DownloadPreview Add to Slideshow
(Subscribers Only)

If you are a subscriber, please log in.

  • Resource
  • Related Resources

Display Title

Animated Math Clip Art--Clock Faces--From 11 to 12

Animated Math Clip Art--Clock Faces--From 11 to 12

This is part of a series of animated math clip art images that show show the time in 15-minute increments. This entire collection covers each of the hours from 12 to 11. Use these animated GIFs with PowerPoint, GoogleSlides, and Media4Math's proprietary Slide Show Creator.

Telling Time

To review telling time, watch this video. (The transcript is also included.)

Video Transcript

When you look at a clock, you can read the hour and the minutes.

Here is a blank clock face.

Let's start by looking at the hour hand.

It is the shorter of the two clock hands and looks like this.

The hour hand varies in value from 1 to 12.

Here is a tour of times around the clock using the hour hand.

12 o'clock.

1 o'clock.

2 o'clock.

3 o'clock.

4 o'clock.

5 o'clock.

6 o'clock.

7 o'clock.

8 o'clock.

9 o'clock.

10 o'clock.

11 o'clock.

And back to 12 o'clock.

The minute hand is the longer of the two clock hands.

This is what it looks like.

The minute hand varies in value from 0 to 60.

Here is a tour of times around the clock in 5-minute increments.

5 minutes after the hour.

10 minutes after the hour.

15 minutes after the hour.

20 minutes after the hour.

25 minutes after the hour.

30 minutes after the hour.

35 minutes after the hour.

40 minutes after the hour.

45 minutes after the hour.

50 minutes after the hour.

55 minutes after the hour.

0 minutes after the hour.

Telling time involves reading both the hour and minute hand.

Here are some examples.

This is 12 o'clock. Both the hour and minute hands point to 12.

This is 12:15. The hour hand is a bit past 12 and the minute hand points to 3.

This is 12:30. The hour hand is between 12 and 1, and the minute hand points to 6.

This is 12:45. The hour hand is closer to 1 and the minute hand points to 9.

This is 1 o'clock. The hour hand points to 1 and the minute hand points to 12.

This pattern repeats for every hour and minute.

The Hour Hand

When you look at a clock, you can read the hour and the minutes. Here is a blank clock face.

Blank clock face.

Let’s start by looking at the hour hand. It is the shorter of the two clock hands and looks like this.

Clock face showing the hour hand.

The hour hand varies in value from 1 to 12. Here are some sample times using the hour hand.

A set of clock faces showing the hour hand.

The Minute Hand

The minute hand is the longer of the two clock hands. This is what it looks like.

Clock face showing the minute hand.

The minute hand varies in value from 0 to 60. Here are some sample times using the minute hand.

Four examples using the minute hand.

The downloadable image is part of a collection of clip art images showing clock faces in five-minute intervals. The collection includes regular and digital clock faces.

Note: The download is a GIF file.

Related Resources

To see additional resources on this topic, click on the Related Resources tab.

Create a Slide Show

Subscribers can use Slide Show Creator to create a slide show from the complete collection of math clip art on this topic. To see the complete clip art collection, click on this Link.

To learn more about Slide Show Creator, click on this Link: 

Accessibility

This resource can also be used with a screen reader. Follow these steps.

  • Click on the Accessibility icon on the upper-right part of the screen.

  • From the menu, click on the Screen Reader button. Then close the Accessibility menu.

  • Click on the PREVIEW button on the left and then click on the definition card. The Screen Reader will read the definition.

Loading…
An error occurred while loading related resources.
No related resources found.
    Common Core Standards CCSS.MATH.CONTENT.1.MD.B.3, CCSS.MATH.CONTENT.2.MD.C.7, CCSS.MATH.CONTENT.3.MD.A.1
    Grade Range K - 2
    Curriculum Nodes Arithmetic
        • Measurement
            • Time
    Copyright Year 2022
    Keywords clocks, time, time measurement, telling time
    Subscribe to Media4Math


    Evan-Moor Learning Line: Telling Time, Grades 1-2 - Activity Book


    glossary


    Media4Math has a huge collection of instructional clip art covering a wide range of math topics. This collection of resources includes images that you can easily incorporate into your lesson plans. 

    There are several ways to access the math clip art library:

    • The table below has the clip art organized into different categories. These sub collections gather all the math clip art on that topic.
    • Use the keyword search field to look for a particular type of image or a math topic supported by clip art.
    • Browse the complete collection.

    Why use math clip art? Because math is sometimes best explained visually, these clip art images were developed with this idea in mind. A single image will show a concept or a sequence of images will develop a concept logically. This collection also includes animated clip art, for those cases where movement onscreen best clarifies a concept.

    Math Clip Art Collection on Media4Math

    Media4Math has an extensive collection of math clip art. Watch this video to learn more.
    Math Clip Art Collection on Media4Math

    The video was uploaded on 5/9/2022.

    You can view the video here.

    The video lasts for 2 minutes and 2 seconds.

    https://www.youtube.com/embed/kkR-eUhAqRQ
    https://youtu.be/kkR-eUhAqRQ?t={seek_to_second_number}


    3D Geometry Clock Faces Fractions--Pizza Slices Linear Functions Parallel Lines Cut by Transversal Statistics
    Adding Decimals Counting Functions and Relations Linear Function Tables Place Value Thermometers
    Angles Concepts Dice and Number Models Geometry Basics  Measurement Playing Cards Triangles
    Animated Clip Art Dividing Fractions by Whole Numbers Geometry Concepts Nets Quadratics  
    Applications of Linear and Quadratic Functions Equations Holiday-Themed Number Systems Ratios, Proportions, Percents  
    Base Ten Blocks Fraction Concepts Language of Math Order of Operations Spinners  


    The Evidence Basis for Instructional Clip Art

    The What Works Clearinghouse has a number of evidence-based Practice Guides that focus on math practices that are associated with effective teaching. For example the Practice Guide entitled Improving Mathematical Problem Solving in Grades 4 Through 8 has one recommendation involving showing visual representations of math concepts. Watch the following video to learn more about the three strategies, with special note of the use of visuals:

    In particular, make a note of this from the practice guide:

    A major task for any student engaged in problem solving is to translate the quantitative information in a problem into a symbolic equation—an arithmetic/algebraic statement— necessary for solving the problem. Visual representations help students solve problems by linking the relationships between quantities in the problem with the mathematical operations needed to solve the problem. Students who learn to visually represent the mathematical information in problems prior to writing an equation are more effective at problem solving.

    Visual representations include tables, graphs, number lines, and diagrams such as strip diagrams, percent bars, and schematic diagrams. Example 10 provides a brief explanation
    of how a few types of visual representations can be used to solve problems.68 In the
    panel’s opinion, teachers should consistently teach students to use a few types of visual representations rather than overwhelming them with many examples. In this recommendation, the panel offers suggestions for selecting appropriate visual representations to teach and methods for teaching students how to represent the problem using a visual representation.

    Media4Math's Clip Art Library includes thousands of images that can be used to visually represent quantities. For example, we have many fraction models that easily be incorporated into the lesson or discussion. When introducing fractions, the fraction clip art collection should be an essential part of your instruction.

    Fractions

    We also include a large number of geometric shapes that can be used in your geometry units. We have area models that can be used to model different processes.

    The Clip Art Library also includes visualizations of math manipulative. For example, algebra tiles, decimal blocks, fraction bars and other manipulative are available as downloadable clip art images.

    The Clip Art Library also includes animated clip art, which is an effective tool for visualizing concepts. Here is an example:

    Clip Art

    The Clip Art Library also includes sequenced images that are useful for showing a process, whether it involves a geometric construction or equation solving.


    • About
    • Privacy Policy
    • Blog
    • Contact Us
    • Accessibility
    • Advertise with Us!

    Follow

    Powered by Media4Math

    © Media4Math. All rights reserved