Content Showcase: Closed Captioned Videos
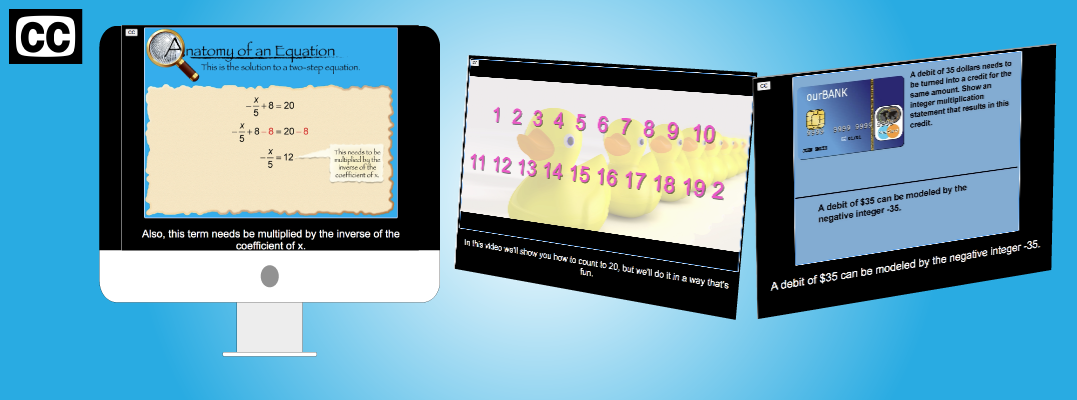
Our videos are closed captioned. This isn't just an issue of accessibility but instruction. Try captioned videos with all your students. The captioning provides an additional level of support for your students as they work their way through our video library.
(Want to learn more about our subscription packages? Click here.)
| Title | Thumbnail Image | Description |
|---|---|---|
Closed Captioned Video: Algebra Applications: Linear Functions, Segment 2: Cycling |
|
Closed Captioned Video: Algebra Applications: Linear Functions, Segment 2: Cycling |
Closed Captioned Video: Box-and-Whisker Plot |
|
Closed Captioned Video: Box-and-Whisker PlotIn this TI Nspire tutorial the Spreadsheet and Statistics windows are used to create a box-and-whisker plot. This video supports the TI-Nspire Clickpad and Touchpad. This Mini-Tutorial Video includes a worksheet. . |
Closed Captioned Video: Linear Function |
|
Closed Captioned Video: Linear FunctionIn this TI Nspire tutorial, the Graph window is used to graph a linear function. This video supports the TI-Nspire Clickpad and Touchpad. This Mini-Tutorial Video includes a worksheet. |
Closed Captioned Video: Linear Inequality |
|
Closed Captioned Video: Linear InequalityIn this TI Nspire tutorial, the Graph window is used to graph a linear inequality. This video supports the TI-Nspire Clickpad and Touchpad. This Mini-Tutorial Video includes a worksheet. |
Closed Captioned Video: Linear Inequality Using Sliders |
|
Closed Captioned Video: Linear Inequality Using SlidersIn this TI Nspire tutorial, the Graph window is used to graph a linear inequality in slope-intercept form using sliders. This video supports the TI-Nspire Clickpad and Touchpad. This Mini-Tutorial Video includes a worksheet. |
Closed Captioned Video: Multiseries Scatterplot |
|
Closed Captioned Video: Multiseries ScatterplotIn this TI Nspire tutorial, Spreadsheet and Graph windows are used to graph a multiseries scatterplot. This video supports the TI-Nspire Clickpad and Touchpad. This Mini-Tutorial Video includes a worksheet. |
Closed Captioned Video: Quadratic Function |
|
Closed Captioned Video: Quadratic FunctionIn this TI Nspire tutorial, the Graph window is used to graph a quadratic function. This video supports the TI-Nspire Clickpad and Touchpad. This Mini-Tutorial Video includes a worksheet. |
Closed Captioned Video: Quadratic Inequality |
|
Closed Captioned Video: Quadratic InequalityIn this TI Nspire tutorial for the TI-Nspire CAS, the Graph Window is used to graph quadratic inequalities. This video supports the TI-Nspire Clickpad and Touchpad. This Mini-Tutorial Video includes a worksheet. |
Closed Captioned Video: Scatterplot 1 |
|
Closed Captioned Video: Scatterplot 1In this TI Nspire tutorial, Spreadsheet and Graph windows are used to graph a scatterplot. This video supports the TI-Nspire Clickpad and Touchpad. This Mini-Tutorial Video includes a worksheet. |
Closed Captioned Video: Scatterplot 2 |
|
Closed Captioned Video: Scatterplot 2In this TI Nspire tutorial, Spreadsheet and Statistics windows are used to graph a scatterplot. This video supports the TI-Nspire Clickpad and Touchpad. This Mini-Tutorial Video includes a worksheet. |
Closed Captioned Video: A Probability Simulation 2 |
|
Closed Captioned Video: A Probability Simulation 2In this TI Nspire tutorial, the Spreadsheet and Statistics windows are used to create a probability simulation of a coin toss. This video supports the TI-Nspire Clickpad and Touchpad. This Mini-Tutorial Video includes a worksheet. . |
Closed Captioned Video: A Probability Simulation 3 |
|
Closed Captioned Video: A Probability Simulation 3In this TI Nspire tutorial, the Spreadsheet and Statistics windows are used to create a probability simulation of tossing two coins. This video supports the TI-Nspire Clickpad and Touchpad. This Mini-Tutorial Video includes a worksheet. . |
Closed Captioned Video: Adding-Subtracting Rational Exp |
|
Closed Captioned Video: Adding-Subtracting Rational ExpIn this TI Nspire tutorial for the TI-Nspire CAS, the Calculator Window is used to combine and simplify rational expressions. This video supports the TI-Nspire Clickpad and Touchpad. This Mini-Tutorial Video includes a worksheet. . |
Closed Captioned Video: Algebra Applications: Data Analysis |
|
Closed Captioned Video: Algebra Applications: Data AnalysisIn this episode of Algebra Applications, students explore the dramatic events of 2008 related to the mortgage crisis. Brought about principally through mortgage defaults, the effect on the overall economy was severe. |
Closed Captioned Video: Algebra Applications: Data Analysis, 1 |

|
Closed Captioned Video: Algebra Applications: Data Analysis, Segment 1: IntroductionIn this introductory segment students learn about the mortage crisis of 2008. In the process they get a brief introduction to what a mortgage is. |
Closed Captioned Video: Algebra Applications: Data Analysis, 2 |
|
Closed Captioned Video: Algebra Applications: Data Analysis, Segment 2: What Is a Mortgage?The time value of money is at the basis of all loans. Students learn about the key factors that determine monthly mortgage payments and use the TI-Nspire to create an amortization table. |
Closed Captioned Video: Algebra Applications: Data Analysis, 3 |
|
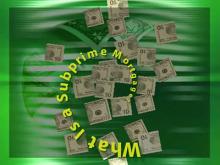
Closed Captioned Video: Algebra Applications: Data Analysis, Segment 3: What Is a What is a Subprime Mortgage?Having learned the general features of a mortgage, students learn the specifics of a subprime mortgage. With this comes the notion of a credit score, and with credit scores come the probabilities for a loan default. |
Closed Captioned Video: Algebra Applications: Data Analysis, 4 |
|
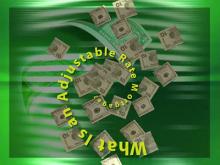
Closed Captioned Video: Algebra Applications: Data Analysis, Segment 4: What is an Adjustable Rate Mortgage?Another factor in the mortgage crisis was the use of adjustable rate mortgages. |
Closed Captioned Video: Algebra Applications: Exponential Functions |

|
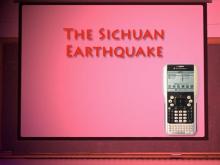
Closed Captioned Video: Algebra Applications: Exponential FunctionsIn this episode of Algebra Applications, students explore earthquakes using exponential models. In particular, students analyze the earthquake that struck the Sichuan Province in China in 2008, months before the Beijing Olympics. |
Closed Captioned Video: Algebra Applications: Exponential Functions, 1 |
|
Closed Captioned Video: Algebra Applications: Exponential Functions, Segment 1: IntroductionIn this episode of Algebra Applications, students explore earthquakes using exponential models. In particular, students analyze the earthquake that struck the Sichuan Province in China in 2008, months before the Beijing Olympics. |
Closed Captioned Video: Algebra Applications: Exponential Functions, 2 |
|
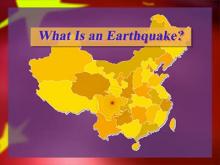
Closed Captioned Video: Algebra Applications: Exponential Functions, Segment 2: What Is an Earthquake?In this episode of Algebra Applications, students explore earthquakes using exponential models. In particular, students analyze the earthquake that struck the Sichuan Province in China in 2008, months before the Beijing Olympics. |
Closed Captioned Video: Algebra Applications: Exponential Functions, 3 |
|
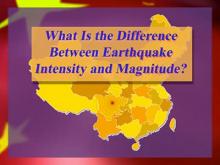
Closed Captioned Video: Algebra Applications: Exponential Functions, Segment 3: What Is the Difference between Earthquake Intensity and Magnitude?In this episode of Algebra Applications, students explore earthquakes using exponential models. |
Closed Captioned Video: Algebra Applications: Exponential Functions, 4 |
|
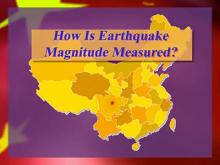
Closed Captioned Video: Algebra Applications: Exponential Functions, Segment 4: How Is Earthquake Magnitude Measured?In this episode of Algebra Applications, students explore earthquakes using exponential models. In particular, students analyze the earthquake that struck the Sichuan Province in China in 2008, months before the Beijing Olympics. |
Closed Captioned Video: Algebra Applications: Functions and Relations |
|
Closed Captioned Video: Algebra Applications: Functions and RelationsThe relationship between slope and grade in cycling is explored. Go on a tour of Italy through the mountains of Tuscany and apply students' understanding of slope. |
Closed Captioned Video: Algebra Applications: Functions and Relations, 1 |
|
Closed Captioned Video: Algebra Applications: Functions and Relations, Segment 1: IntroductionScientists use conic sections to map the trajectories of spacecraft in flight. The setting for this episode is a planned future flight to Mars. As the ship travels from Earth to Mars, parabolic, circular, and elliptical paths are explored. |