Skip to content

Media4Math Library

  • Home
  • Search
  • Subscribe
  • Content
    Newest Resources Free Resources Content Showcase Topic Collections Classroom Modules SAT Test Prep Blog Training Videos Self-Paced Courses
  • Standards
    CCSS Standards (K-12) TEKS (K-5) TEKS (6-12) NYS (K-5) NYS (6-8) NYS (9-12) FL (K-5) FL (6-8) FL (9-12)
  • Getting Started
    Educators Tutors Parents
  • Funding
    Media4Math Foundation Donors Choose
  • Partners
  • Classroom
  • Log in

NYS

These are the resources that support this NYS Standard.

NY-AII-S.ID.4a

There are 63 resources.
Title Description Thumbnail Image Curriculum Topics

Apple Harvest

In this module students analyze real-world data relating to apple production and consumption. Looking at global and US data, students look at measures of central tendency by analyzing a box-and-whisker plot and later normal distribution graphs.

Math topics covered include:

  • Median
  • Mean
  • Box-and-whisker plot
  • Normal distribution
  • Sample mean and sample standard deviation

This module includes three videos that provide examples, definitions, and real-world context. Supplement this module with hands-on activities where students calculate their own data from random samples. 

Closed Captioned Video: Measures of Central Tendency: Finding the Mean of a Data Set I

In this video tutorial students learn how to calculate the mean when all of the data items are positive numbers. Includes three real-world examples. 

A Video Transcript is available for this tutorial at this Link

Note: The download is Media4Math's guide to closed captioned videos.

Other Closed Captioned Videos

To see the complete collection of Closed Captioned Videos, click on this Link

Slide1_1.jpeg Data Analysis, Data Gathering

Closed Captioned Video: Measures of Central Tendency: Finding the Mean of a Data Set II

In this video tutorial students learn how to calculate the mean when some of the data items are negative numbers. Includes three real-world examples. 

A Video Transcript is available for this tutorial at this Link

Note: The download is Media4Math's guide to closed captioned videos.

Other Closed Captioned Videos

To see the complete collection of Closed Captioned Videos, click on this Link

Slide2_0.jpeg Data Analysis, Data Gathering

Closed Captioned Video: Measures of Central Tendency: Finding the Median of a Data Set

In this video tutorial students learn how to find the median of a data set. The mean is also calculated so that students can learn similarities and differences between these two measures of central tendency. Includes three real-world examples. 

A Video Transcript is available for this tutorial at this Link

Note: The download is Media4Math's guide to closed captioned videos.

Other Closed Captioned Videos

To see the complete collection of Closed Captioned Videos, click on this Link

Slide3.jpeg Data Analysis, Data Gathering

Closed Captioned Video: Measures of Central Tendency: Finding the Mode of a Data Set

In this video tutorial students learn how to calculate the mode of a data set, as well as how the mode differs from the mean and median.Includes three real-world examples. 

A Video Transcript is available for this tutorial at this Link

Note: The download is Media4Math's guide to closed captioned videos.

Other Closed Captioned Videos

To see the complete collection of Closed Captioned Videos, click on this Link

Slide5.jpeg Data Analysis, Data Gathering

Closed Captioned Video: Measures of Central Tendency: Mean of a Probability Distribution

In this video tutorial students learn about the mean of a probability distribution. Includes a brief discussion of expected value, plus a brief tie-in to weighted means. Includes three real-world examples. 

A Video Transcript is available for this tutorial at this Link

Note: The download is Media4Math's guide to closed captioned videos.

Other Closed Captioned Videos

To see the complete collection of Closed Captioned Videos, click on this Link

Slide8.jpeg Data Analysis, Data Gathering

Closed Captioned Video: Measures of Central Tendency: Sample Mean

In this video tutorial students learn about sample mean from a random sampling of data. All examples involve normally distributed data with a known population mean and standard deviation. Includes three real-world examples. 

A Video Transcript is available for this tutorial at this Link

Note: The download is Media4Math's guide to closed captioned videos.

Other Closed Captioned Videos

To see the complete collection of Closed Captioned Videos, click on this Link

Slide7.jpeg Data Analysis, Data Gathering

Closed Captioned Video: Measures of Central Tendency: The Mean and Normally Distributed Data

In this video tutorial students learn about normally distributed data and how to identify the population mean from the normal distribution. Standard deviation is briefly introduced. Includes three real-world examples. 

A Video Transcript is available for this tutorial at this Link

Note: The download is Media4Math's guide to closed captioned videos.

Other Closed Captioned Videos

To see the complete collection of Closed Captioned Videos, click on this Link

Slide6.jpeg Data Analysis, Data Gathering

Closed Captioned Video: Measures of Central Tendency: Weighted Mean

In this video tutorial students extend their understanding of mean by looking at examples of weighted means (sometimes referred to as weighted averages). Includes three real-world examples. 

A Video Transcript is available for this tutorial at this Link

Note: The download is Media4Math's guide to closed captioned videos.

Other Closed Captioned Videos

To see the complete collection of Closed Captioned Videos, click on this Link

Slide4.jpeg Data Analysis, Data Gathering

Closed Captioned Video: TI-Nspire Mini-Tutorial: A Probability Simulation of Rolling Two Dice Multiple Times (with Histogram)

In this TI Nspire tutorialthe Spreadsheet and Statistics windows are used to create a probability simulation of tossing two dice. This video supports the TI-Nspire Clickpad and Touchpad.

This Mini-Tutorial Video includes a WORKSHEET: https://www.media4math.com/library/worksheet-ti-nspire-mini-tutorial-probability-simulation-rolling-two-dice-multiple-times

A Video Transcript is available for this tutorial at this Link

Note: The download is Media4Math's guide to closed captioned videos.

Other Closed Captioned Videos

To see the complete collection of Closed Captioned Videos, click on this Link.

NspireTutorial--ProbabilityExpTwoDice.jpg Probability

Closed Captioned Video: TI-Nspire Mini-Tutorial: Creating a Histogram

In this TI Nspire tutorial, the Spreadsheet and Statistics windows are used to create a histogram. This video supports the TI-Nspire Clickpad and Touchpad.

This Mini-Tutorial Video includes a WORKSHEET: https://www.media4math.com/library/worksheet-ti-nspire-mini-tutorial-creating-histogram

A Video Transcript is available for this tutorial at this Link.

Note: The download is Media4Math's guide to closed captioned videos.

Other Closed Captioned Videos

To see the complete collection of Closed Captioned Videos, click on this Link.

NspireTutorial--Histogram.jpg Data Analysis

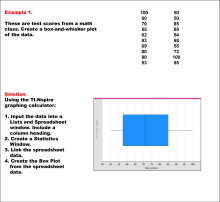
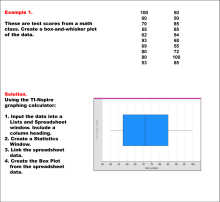
Closed Captioned Video: TI-Nspire Mini-Tutorial: Graphing a Box-and-Whisker Plot

In this TI Nspire tutorial the Spreadsheet and Statistics windows are used to create a box-and-whisker plot. This video supports the TI-Nspire Clickpad and Touchpad.

This Mini-Tutorial Video includes a WORKSHEET: https://www.media4math.com/library/worksheet-ti-nspire-mini-tutorial-graphing-box-and-whisker-plot

A Video Transcript is available for this tutorial at this Link

Other Closed Captioned Videos

To see the complete collection of Closed Captioned Videos, click on this Link.

NspireTutorial--BoxAndWhisker.jpg Data Analysis

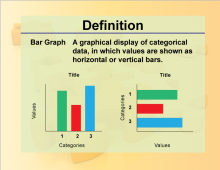
Definition--Charts and Graphs--Bar Graph

This is a collection of definitions related to the concept of charts, graphs, and data displays.

Note: The download is a PNG file.

Related Resources

To see additional resources on this topic, click on the Related Resources tab.

Create a Slide Show

Subscribers can use Slide Show Creator to create a slide show from the complete collection of math definitions on this topic. To see the complete collection of definitions, click on this Link.

To learn more about Slide Show Creator, click on this Link.

Accessibility

This resource can also be used with a screen reader. Follow these steps.

  • Click on the Accessibility icon on the upper-right part of the screen.

  • From the menu, click on the Screen Reader button. Then close the Accessibility menu.

  • Click on the PREVIEW button on the left and then click on the definition card. The Screen Reader will read the definition.

Definition--Charts and Graphs--Bar Graph Data Analysis

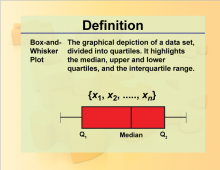
Definition--Charts and Graphs--Box-and-Whisker Plot

This is a collection of definitions related to the concept of charts, graphs, and data displays.

Note: The download is a PNG file.

Related Resources

To see additional resources on this topic, click on the Related Resources tab.

Create a Slide Show

Subscribers can use Slide Show Creator to create a slide show from the complete collection of math definitions on this topic. To see the complete collection of definitions, click on this Link.

To learn more about Slide Show Creator, click on this Link.

Accessibility

This resource can also be used with a screen reader. Follow these steps.

  • Click on the Accessibility icon on the upper-right part of the screen.

  • From the menu, click on the Screen Reader button. Then close the Accessibility menu.

  • Click on the PREVIEW button on the left and then click on the definition card. The Screen Reader will read the definition.

Definition--Charts and Graphs--Box-and-Whisker Plot Data Analysis

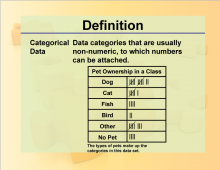
Definition--Charts and Graphs--Categorical Data

This is a collection of definitions related to the concept of charts, graphs, and data displays.

Note: The download is a PNG file.

Related Resources

To see additional resources on this topic, click on the Related Resources tab.

Create a Slide Show

Subscribers can use Slide Show Creator to create a slide show from the complete collection of math definitions on this topic. To see the complete collection of definitions, click on this Link.

To learn more about Slide Show Creator, click on this Link.

Accessibility

This resource can also be used with a screen reader. Follow these steps.

  • Click on the Accessibility icon on the upper-right part of the screen.

  • From the menu, click on the Screen Reader button. Then close the Accessibility menu.

  • Click on the PREVIEW button on the left and then click on the definition card. The Screen Reader will read the definition.

Definition--Charts and Graphs--Categorical Data Data Analysis

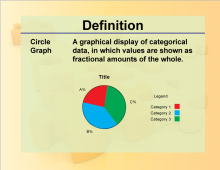
Definition--Charts and Graphs--Circle Graph

This is a collection of definitions related to the concept of charts, graphs, and data displays.

Note: The download is a PNG file.

Related Resources

To see additional resources on this topic, click on the Related Resources tab.

Create a Slide Show

Subscribers can use Slide Show Creator to create a slide show from the complete collection of math definitions on this topic. To see the complete collection of definitions, click on this Link.

To learn more about Slide Show Creator, click on this Link.

Accessibility

This resource can also be used with a screen reader. Follow these steps.

  • Click on the Accessibility icon on the upper-right part of the screen.

  • From the menu, click on the Screen Reader button. Then close the Accessibility menu.

  • Click on the PREVIEW button on the left and then click on the definition card. The Screen Reader will read the definition.

Definition--Charts and Graphs--Circle Graph Data Analysis

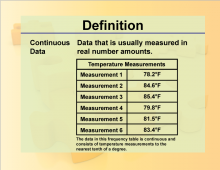
Definition--Charts and Graphs--Continuous Data

This is a collection of definitions related to the concept of charts, graphs, and data displays.

Note: The download is a PNG file.

Related Resources

To see additional resources on this topic, click on the Related Resources tab.

Create a Slide Show

Subscribers can use Slide Show Creator to create a slide show from the complete collection of math definitions on this topic. To see the complete collection of definitions, click on this Link.

To learn more about Slide Show Creator, click on this Link.

Accessibility

This resource can also be used with a screen reader. Follow these steps.

  • Click on the Accessibility icon on the upper-right part of the screen.

  • From the menu, click on the Screen Reader button. Then close the Accessibility menu.

  • Click on the PREVIEW button on the left and then click on the definition card. The Screen Reader will read the definition.

Definition--Charts and Graphs--Continuous Data Data Analysis

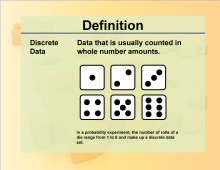
Definition--Charts and Graphs--Discrete Data

This is a collection of definitions related to the concept of charts, graphs, and data displays.

Note: The download is a PNG file.

Related Resources

To see additional resources on this topic, click on the Related Resources tab.

Create a Slide Show

Subscribers can use Slide Show Creator to create a slide show from the complete collection of math definitions on this topic. To see the complete collection of definitions, click on this Link.

To learn more about Slide Show Creator, click on this Link.

Accessibility

This resource can also be used with a screen reader. Follow these steps.

  • Click on the Accessibility icon on the upper-right part of the screen.

  • From the menu, click on the Screen Reader button. Then close the Accessibility menu.

  • Click on the PREVIEW button on the left and then click on the definition card. The Screen Reader will read the definition.

Definition--Charts and Graphs--Discrete Data Data Analysis

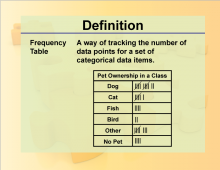
Definition--Charts and Graphs--Frequency Table

This is a collection of definitions related to the concept of charts, graphs, and data displays.

Note: The download is a PNG file.

Related Resources

To see additional resources on this topic, click on the Related Resources tab.

Create a Slide Show

Subscribers can use Slide Show Creator to create a slide show from the complete collection of math definitions on this topic. To see the complete collection of definitions, click on this Link.

To learn more about Slide Show Creator, click on this Link.

Accessibility

This resource can also be used with a screen reader. Follow these steps.

  • Click on the Accessibility icon on the upper-right part of the screen.

  • From the menu, click on the Screen Reader button. Then close the Accessibility menu.

  • Click on the PREVIEW button on the left and then click on the definition card. The Screen Reader will read the definition.

Definition--Charts and Graphs--Frequency Table Data Analysis

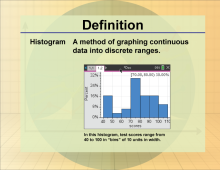
Definition--Charts and Graphs--Histogram

This is a collection of definitions related to the concept of charts, graphs, and data displays.

Note: The download is a PNG file.

Related Resources

To see additional resources on this topic, click on the Related Resources tab.

Create a Slide Show

Subscribers can use Slide Show Creator to create a slide show from the complete collection of math definitions on this topic. To see the complete collection of definitions, click on this Link.

To learn more about Slide Show Creator, click on this Link.

Accessibility

This resource can also be used with a screen reader. Follow these steps.

  • Click on the Accessibility icon on the upper-right part of the screen.

  • From the menu, click on the Screen Reader button. Then close the Accessibility menu.

  • Click on the PREVIEW button on the left and then click on the definition card. The Screen Reader will read the definition.

Definition--Charts and Graphs--Histogram Data Analysis

Definition--Charts and Graphs--Joint Frequencies

This is a collection of definitions related to the concept of charts, graphs, and data displays.

Note: The download is a PNG file.

Related Resources

To see additional resources on this topic, click on the Related Resources tab.

Create a Slide Show

Subscribers can use Slide Show Creator to create a slide show from the complete collection of math definitions on this topic. To see the complete collection of definitions, click on this Link.

To learn more about Slide Show Creator, click on this Link.

Accessibility

This resource can also be used with a screen reader. Follow these steps.

  • Click on the Accessibility icon on the upper-right part of the screen.

  • From the menu, click on the Screen Reader button. Then close the Accessibility menu.

  • Click on the PREVIEW button on the left and then click on the definition card. The Screen Reader will read the definition.

Definition--Charts and Graphs--Joint Frequencies Data Analysis

Definition--Charts and Graphs--Line Graph

This is a collection of definitions related to the concept of charts, graphs, and data displays.

Note: The download is a PNG file.

Related Resources

To see additional resources on this topic, click on the Related Resources tab.

Create a Slide Show

Subscribers can use Slide Show Creator to create a slide show from the complete collection of math definitions on this topic. To see the complete collection of definitions, click on this Link.

To learn more about Slide Show Creator, click on this Link.

Accessibility

This resource can also be used with a screen reader. Follow these steps.

  • Click on the Accessibility icon on the upper-right part of the screen.

  • From the menu, click on the Screen Reader button. Then close the Accessibility menu.

  • Click on the PREVIEW button on the left and then click on the definition card. The Screen Reader will read the definition.

Definition--Charts and Graphs--Line Graph Data Analysis

Definition--Charts and Graphs--Line Plot

This is a collection of definitions related to the concept of charts, graphs, and data displays.

Note: The download is a PNG file.

Related Resources

To see additional resources on this topic, click on the Related Resources tab.

Create a Slide Show

Subscribers can use Slide Show Creator to create a slide show from the complete collection of math definitions on this topic. To see the complete collection of definitions, click on this Link.

To learn more about Slide Show Creator, click on this Link.

Accessibility

This resource can also be used with a screen reader. Follow these steps.

  • Click on the Accessibility icon on the upper-right part of the screen.

  • From the menu, click on the Screen Reader button. Then close the Accessibility menu.

  • Click on the PREVIEW button on the left and then click on the definition card. The Screen Reader will read the definition.

Definition--Charts and Graphs--Line Plot Data Analysis

Definition--Charts and Graphs--Pictograph

This is a collection of definitions related to the concept of charts, graphs, and data displays.

Note: The download is a PNG file.

Related Resources

To see additional resources on this topic, click on the Related Resources tab.

Create a Slide Show

Subscribers can use Slide Show Creator to create a slide show from the complete collection of math definitions on this topic. To see the complete collection of definitions, click on this Link.

To learn more about Slide Show Creator, click on this Link.

Accessibility

This resource can also be used with a screen reader. Follow these steps.

  • Click on the Accessibility icon on the upper-right part of the screen.

  • From the menu, click on the Screen Reader button. Then close the Accessibility menu.

  • Click on the PREVIEW button on the left and then click on the definition card. The Screen Reader will read the definition.

Definition--Charts and Graphs--Pictograph Data Analysis

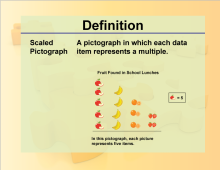
Definition--Charts and Graphs--Scaled Pictograph

This is a collection of definitions related to the concept of charts, graphs, and data displays.

Note: The download is a PNG file.

Related Resources

To see additional resources on this topic, click on the Related Resources tab.

Create a Slide Show

Subscribers can use Slide Show Creator to create a slide show from the complete collection of math definitions on this topic. To see the complete collection of definitions, click on this Link.

To learn more about Slide Show Creator, click on this Link.

Accessibility

This resource can also be used with a screen reader. Follow these steps.

  • Click on the Accessibility icon on the upper-right part of the screen.

  • From the menu, click on the Screen Reader button. Then close the Accessibility menu.

  • Click on the PREVIEW button on the left and then click on the definition card. The Screen Reader will read the definition.

Definition--Charts and Graphs--Scaled Pictograph Data Analysis

Pagination

  • Current page 1
  • Page 2
  • Page 3
  • Next page ››

  • About
  • Privacy Policy
  • Blog
  • Contact Us
  • Accessibility

Follow

Powered by Media4Math

© Media4Math. All rights reserved