
These are the resources that support this NYS Standard.
NY-7.SP.3: Informally assess the degree of visual overlap of two numerical data distributions with similar variabilities, measuring the difference between the centers by expressing it as a multiple of a measure of variability. For example, the mean height of players on the basketball team is 10 cm greater than the mean height of players on the soccer team, about twice the variability (mean absolute deviation) on either team; on a dot plot, the separation between the two distributions of heights is noticeable.
There are 42 resources.| Title | Description | Thumbnail Image | Curriculum Topics |
|---|---|---|---|
Math Definitions Collection: Statistics and Probability |
This collection aggregates all the definition image cards around the topic of Statistics and Probability terms and vocabulary. There are a total of 34 terms. | 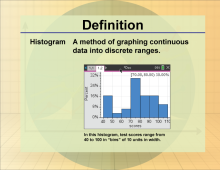
|
Data Analysis, Probability and Data Gathering |
Math Video Collection: Video Tutorials Series: Measures of Central Tendency |
Overview This coThis collection aggregates all the math videos and resources in this series: Video Tutorials Series: Measures of Central Tendency. There are a total of 24 resources. | 
|
Data Analysis and Data Gathering |
Math Clip Art Collection: Statistics |
Overview This colleThis collection aggregates all the math clip art around the topic of Statistics. There are a total of 55 images. | 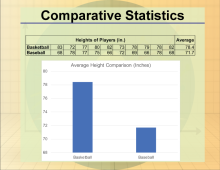
|
Data Analysis, Probability, Data Gathering and Counting |
Closed Captioned Video: Measures of Central Tendency: Finding the Mean of a Data Set I |
Closed Captioned Video: Measures of Central Tendency: Finding the Mean of a Data Set I
In this video tutorial students learn how to calculate the mean when all of the data items are positive numbers. Includes three real-world examples. |
|
Data Analysis and Data Gathering |
Closed Captioned Video: Measures of Central Tendency: Finding the Mean of a Data Set II |
Closed Captioned Video: Measures of Central Tendency: Finding the Mean of a Data Set II
In this video tutorial students learn how to calculate the mean when some of the data items are negative numbers. Includes three real-world examples. |
|
Data Analysis and Data Gathering |
Closed Captioned Video: Measures of Central Tendency: Finding the Median of a Data Set |
Closed Captioned Video: Measures of Central Tendency: Finding the Median of a Data Set
In this video tutorial students learn how to find the median of a data set. The mean is also calculated so that students can learn similarities and differences between these two measures of central tendency. Includes three real-world examples. |
|
Data Analysis and Data Gathering |
Closed Captioned Video: Measures of Central Tendency: Finding the Mode of a Data Set |
Closed Captioned Video: Measures of Central Tendency: Finding the Mode of a Data Set
In this video tutorial students learn how to calculate the mode of a data set, as well as how the mode differs from the mean and median.Includes three real-world examples. |
|
Data Analysis and Data Gathering |
Closed Captioned Video: Measures of Central Tendency: Mean of a Probability Distribution |
Closed Captioned Video: Measures of Central Tendency: Mean of a Probability Distribution
In this video tutorial students learn about the mean of a probability distribution. Includes a brief discussion of expected value, plus a brief tie-in to weighted means. Includes three real-world examples. |
|
Data Analysis and Data Gathering |
Closed Captioned Video: Measures of Central Tendency: Sample Mean |
Closed Captioned Video: Measures of Central Tendency: Sample Mean
In this video tutorial students learn about sample mean from a random sampling of data. All examples involve normally distributed data with a known population mean and standard deviation. Includes three real-world examples. |
|
Data Analysis and Data Gathering |
Closed Captioned Video: Measures of Central Tendency: The Mean and Normally Distributed Data |
Closed Captioned Video: Measures of Central Tendency: The Mean and Normally Distributed Data
In this video tutorial students learn about normally distributed data and how to identify the population mean from the normal distribution. Standard deviation is briefly introduced. Includes three real-world examples. |
|
Data Analysis and Data Gathering |
Closed Captioned Video: Measures of Central Tendency: Weighted Mean |
Closed Captioned Video: Measures of Central Tendency: Weighted Mean
In this video tutorial students extend their understanding of mean by looking at examples of weighted means (sometimes referred to as weighted averages). Includes three real-world examples. |

|
Data Analysis and Data Gathering |
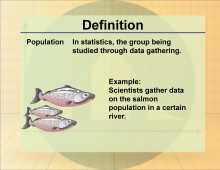
Definition--Statistics and Probability Concepts--Population |
Definition--Statistics and Probability Concepts--Population
This is part of a collection of definitions on the topic of probability and statistics. Each definition includes an example of the term. |
|
Data Gathering |
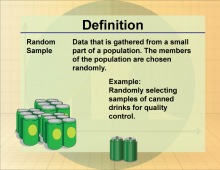
Definition--Statistics and Probability Concepts--Random Sample |
Definition--Statistics and Probability Concepts--Random Sample
This is part of a collection of definitions on the topic of probability and statistics. Each definition includes an example of the term. |
|
Data Gathering |
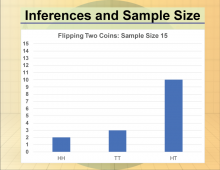
Math Clip Art--Statistics and Probability-- Inferences and Sample Size--10 |
Math Clip Art--Statistics and Probability-- Inferences and Sample Size--10
This is part of a collection of math clip art images that show different statistical graphs and concepts, along with some probability concepts. |
|
Data Gathering |
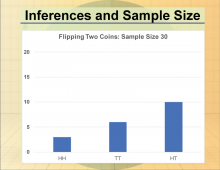
Math Clip Art--Statistics and Probability-- Inferences and Sample Size--11 |
Math Clip Art--Statistics and Probability-- Inferences and Sample Size--11
This is part of a collection of math clip art images that show different statistical graphs and concepts, along with some probability concepts. |
|
Data Gathering |
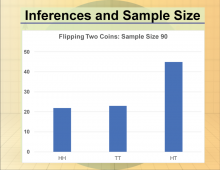
Math Clip Art--Statistics and Probability-- Inferences and Sample Size--12 |
Math Clip Art--Statistics and Probability-- Inferences and Sample Size--12
This is part of a collection of math clip art images that show different statistical graphs and concepts, along with some probability concepts. |
|
Data Gathering |
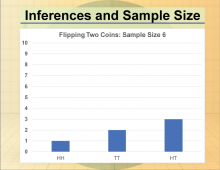
Math Clip Art--Statistics and Probability-- Inferences and Sample Size--9 |
Math Clip Art--Statistics and Probability-- Inferences and Sample Size--9
This is part of a collection of math clip art images that show different statistical graphs and concepts, along with some probability concepts. |
|
Data Gathering |
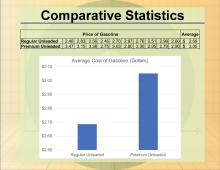
Math Clip Art--Statistics--Comparative Statistic--02 |
Math Clip Art--Statistics--Comparative Statistic--02
This is part of a collection of math clip art images that show different statistical graphs and concepts, along with some probability concepts. |
|
Data Analysis |
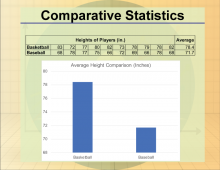
Math Clip Art--Statistics--Comparative Statistics--01 |
Math Clip Art--Statistics--Comparative Statistics--01
This is part of a collection of math clip art images that show different statistical graphs and concepts, along with some probability concepts. |
|
Data Analysis |
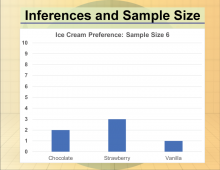
Math Clip Art--Statistics--Inferences and Sample Size--01 |
Math Clip Art--Statistics--Inferences and Sample Size--01
This is part of a collection of math clip art images that show different statistical graphs and concepts, along with some probability concepts. |
|
Data Gathering |
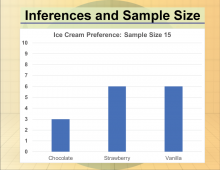
Math Clip Art--Statistics--Inferences and Sample Size--02 |
Math Clip Art--Statistics--Inferences and Sample Size--02
This is part of a collection of math clip art images that show different statistical graphs and concepts, along with some probability concepts. |
|
Data Gathering |
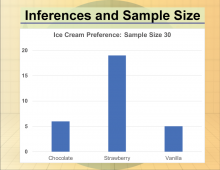
Math Clip Art--Statistics--Inferences and Sample Size--03 |
Math Clip Art--Statistics--Inferences and Sample Size--03
This is part of a collection of math clip art images that show different statistical graphs and concepts, along with some probability concepts. |
|
Data Gathering |
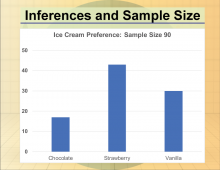
Math Clip Art--Statistics--Inferences and Sample Size--04 |
Math Clip Art--Statistics--Inferences and Sample Size--04
This is part of a collection of math clip art images that show different statistical graphs and concepts, along with some probability concepts. |
|
Data Gathering |
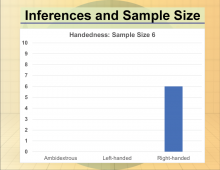
Math Clip Art--Statistics--Inferences and Sample Size--05 |
Math Clip Art--Statistics--Inferences and Sample Size--05
This is part of a collection of math clip art images that show different statistical graphs and concepts, along with some probability concepts. |
|
Data Gathering |
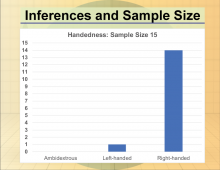
Math Clip Art--Statistics--Inferences and Sample Size--06 |
Math Clip Art--Statistics--Inferences and Sample Size--06
This is part of a collection of math clip art images that show different statistical graphs and concepts, along with some probability concepts. |
|
Data Gathering |

