
These are the resources that support this Florida Standard.
MAFS.8.SP.1.2: Know that straight lines are widely used to model relationships between two quantitative variables. For scatter plots that suggest a linear association, informally fit a straight line, and informally assess the model fit by judging the closeness of the data points to the line.
There are 29 resources.| Title | Description | Thumbnail Image | Curriculum Topics |
|---|---|---|---|
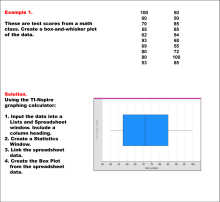
Math Examples Collection: Charts, Graphs, and Plots |
|
Slope-Intercept Form, Data Analysis, Point-Slope Form and Subtraction Facts to 100 | |
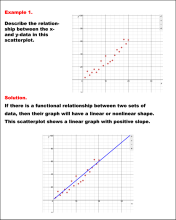
Math Examples Collection: Analyzing Scatterplots |
|
Data Analysis | |
Math Video Collection: Texas Instruments Tutorial Videos |
Overview This colle |

|
Rational Expressions, Sequences, Series, Polynomial Functions and Equations, Graphs of Quadratic Functions, Quadratic Equations and Functions, Solving Systems of Equations, Trig Expressions and Identities, Probability, Geometric Constructions with Triangles, Composite Functions, Geometric Constructions with Angles and Planes, Distance Formula, Data Analysis, Slope, Special Functions, Trigonometric Functions, Graphs of Exponential and Logarithmic Functions, Radical Functions and Equations, Rational Functions and Equations, Slope-Intercept Form, Coordinate Systems, Graphs of Linear Functions, Inequalities, Matrix Operations and Midpoint Formula |
Closed Captioned Video: Multiseries Scatterplot |
Closed Captioned Video: Multiseries ScatterplotIn this TI Nspire tutorial, Spreadsheet and Graph windows are used to graph a multiseries scatterplot. This video supports the TI-Nspire Clickpad and Touchpad. This Mini-Tutorial Video includes a worksheet. |

|
Data Analysis |
Closed Captioned Video: Scatterplot 1 |
Closed Captioned Video: Scatterplot 1In this TI Nspire tutorial, Spreadsheet and Graph windows are used to graph a scatterplot. This video supports the TI-Nspire Clickpad and Touchpad. This Mini-Tutorial Video includes a worksheet. |

|
Data Analysis |
Closed Captioned Video: Scatterplot 2 |
Closed Captioned Video: Scatterplot 2In this TI Nspire tutorial, Spreadsheet and Statistics windows are used to graph a scatterplot. This video supports the TI-Nspire Clickpad and Touchpad. This Mini-Tutorial Video includes a worksheet. |
|
Data Analysis |
INSTRUCTIONAL RESOURCE: Algebra Application: The Rise of K-Pop |
INSTRUCTIONAL RESOURCE: Algebra Application: The Rise of K-PopIn this Algebra Application, students examine the music industry, specifically the rise of Korean pop music, or K-Pop. Using industry data students examine tables and graphs of categorical data before identifying possible functional relationships. |

|
Applications of Linear Functions and Data Analysis |
INSTRUCTIONAL RESOURCE: Algebra Application: When Will Space Travel Be Affordable? |
INSTRUCTIONAL RESOURCE: Algebra Application: When Will Space Travel Be Affordable?In this Algebra Application, students examine the budding industry of commercial space travel. Using data from the Bureau of Transportation Statistics, students build a mathematical model from historical airfare data. |

|
Applications of Exponential and Logarithmic Functions, Applications of Linear Functions and Data Analysis |
INSTRUCTIONAL RESOURCE: Nspire App Tutorial: Graphing a Scatterplot |
In this Slide Show, learn how graph data in a scatterplot using the graph window. This presentation requires the use of the TI-Nspire iPad App. Note: the download is a PPT. |

|
Graphs of Linear Functions, Slope-Intercept Form and Data Analysis |
Math Example--Charts, Graphs, and Plots--Analyzing Scatterplots: Example 1 |
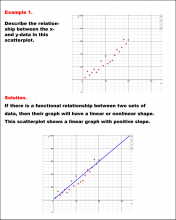
Math Example--Charts, Graphs, and Plots-- Analyzing Scatterplots: Example 1In this set of math examples, analyze the behavior of different scatterplots. This includes linear and quadratic models. |
|
Data Analysis |
Math Example--Charts, Graphs, and Plots--Analyzing Scatterplots: Example 10 |
Math Example--Charts, Graphs, and Plots-- Analyzing Scatterplots: Example 10In this set of math examples, analyze the behavior of different scatterplots. This includes linear and quadratic models. |
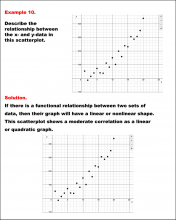
|
Data Analysis |
Math Example--Charts, Graphs, and Plots--Analyzing Scatterplots: Example 2 |
Math Example--Charts, Graphs, and Plots-- Analyzing Scatterplots: Example 2In this set of math examples, analyze the behavior of different scatterplots. This includes linear and quadratic models. |
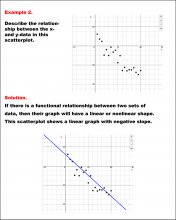
|
Data Analysis |
Math Example--Charts, Graphs, and Plots--Analyzing Scatterplots: Example 3 |
Math Example--Charts, Graphs, and Plots-- Analyzing Scatterplots: Example 3In this set of math examples, analyze the behavior of different scatterplots. This includes linear and quadratic models. |
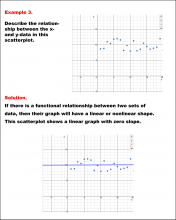
|
Data Analysis |
Math Example--Charts, Graphs, and Plots--Analyzing Scatterplots: Example 4 |
Math Example--Charts, Graphs, and Plots-- Analyzing Scatterplots: Example 4In this set of math examples, analyze the behavior of different scatterplots. This includes linear and quadratic models. |
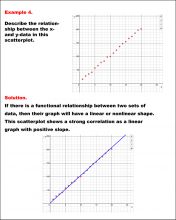
|
Data Analysis |
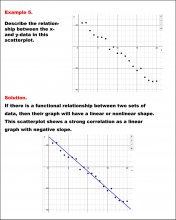
Math Example--Charts, Graphs, and Plots--Analyzing Scatterplots: Example 5 |
Math Example--Charts, Graphs, and Plots-- Analyzing Scatterplots: Example 5In this set of math examples, analyze the behavior of different scatterplots. This includes linear and quadratic models. |
|
Data Analysis |
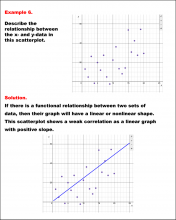
Math Example--Charts, Graphs, and Plots--Analyzing Scatterplots: Example 6 |
Math Example--Charts, Graphs, and Plots-- Analyzing Scatterplots: Example 6In this set of math examples, analyze the behavior of different scatterplots. This includes linear and quadratic models. |
|
Data Analysis |
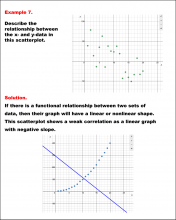
Math Example--Charts, Graphs, and Plots--Analyzing Scatterplots: Example 7 |
Math Example--Charts, Graphs, and Plots-- Analyzing Scatterplots: Example 7In this set of math examples, analyze the behavior of different scatterplots. This includes linear and quadratic models. |
|
Data Analysis |
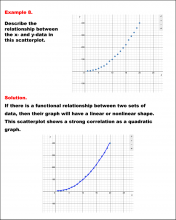
Math Example--Charts, Graphs, and Plots--Analyzing Scatterplots: Example 8 |
Math Example--Charts, Graphs, and Plots-- Analyzing Scatterplots: Example 8In this set of math examples, analyze the behavior of different scatterplots. This includes linear and quadratic models. |
|
Data Analysis |
Math Example--Charts, Graphs, and Plots--Analyzing Scatterplots: Example 9 |
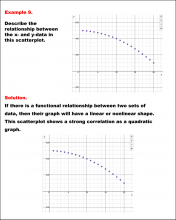
Math Example--Charts, Graphs, and Plots-- Analyzing Scatterplots: Example 9In this set of math examples, analyze the behavior of different scatterplots. This includes linear and quadratic models. |
|
Data Analysis |
Video Transcript: TI-Nspire Mini-Tutorial: Graphing a Multiseries Scatterplot Using a Graphs and Geometry Window |
Video Transcript: TI-Nspire Mini-Tutorial: Graphing a Multiseries Scatterplot Using a Graphs and Geometry WindowThis is the transcript for the TI-Nspire Mini-Tutorial entitled, Graphing a Multiseries Scatterplot Using a Graphs and Geometry Window. |

|
Data Analysis |
Video Transcript: TI-Nspire Mini-Tutorial: Graphing a Scatterplot Using a Graphs and Geometry Window |
Video Transcript: TI-Nspire Mini-Tutorial: Graphing a Scatterplot Using a Graphs and Geometry WindowThis is the transcript for the TI-Nspire Mini-Tutorial entitled, Graphing a Scatterplot Using a Graphs and Geometry Window. |

|
Data Analysis |
Video Transcript: TI-Nspire Mini-Tutorial: Graphing a Scatterplot Using a Statistics Window |
Video Transcript: TI-Nspire Mini-Tutorial: Graphing a Scatterplot Using a Statistics WindowThis is the transcript for the TI-Nspire Mini-Tutorial entitled, Graphing a Scatterplot Using a Statistics Window. |

|
Data Analysis |
Video Tutorial: Line of Best Fit |
Video Tutorial: Line of Best FitThis video looks at the Line of Best Fit. A real-world data set is analyzed, from which a linear function in slope-intercept is derived. Students are shown how to find the line of best fit using a TI graphing calculator. Strategies for estimating the line of best fit are also explored. |

|
Slope-Intercept Form and Data Analysis |
VIDEO: Ti-Nspire Mini-Tutorial, Video 6 |
VIDEO: TI-Nspire CX Mini-Tutorial: Graphing a ScatterplotIn this TI-Nspire CX tutorial learn how graph data in a scatterplot using the graph window. |

|
Data Analysis |
VIDEO: Ti-Nspire Mini-Tutorial, Video 80 |
VIDEO: TI-Nspire Mini-Tutorial: Graphing a Multiseries Scatterplot Using a Graphs and Geometry WindowIn this TI Nspire tutorial, Spreadsheet and Graph windows are used to graph a multiseries scatterplot. This video supports the TI-Nspire Clickpad and Touchpad. |

|
Data Analysis |

