These are the resources that support this Florida Standard.
MAFS.7.SP.1.1: Understand that statistics can be used to gain information about a population by examining a sample of the population; generalizations about a population from a sample are valid only if the sample is representative of that population. Understand that random sampling tends to produce representative samples and support valid inferences.
There are 21 resources.| Title | Description | Thumbnail Image | Curriculum Topics |
|---|---|---|---|
Math in the News Collection: Applications of Data Analysis |

|
Data Analysis, Data Gathering, Probability, Percents and Ratios and Rates | |
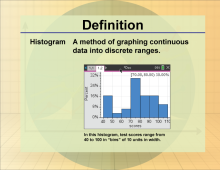
Math Definitions Collection: Statistics and Probability |
|
Data Analysis, Probability and Data Gathering | |
Math Clip Art Collection: Statistics |
Overview This colle |
|
Data Analysis, Probability, Data Gathering and Counting |
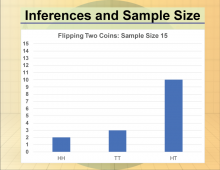
Math Clip Art--Statistics and Probability-- Inferences and Sample Size--10 |
Math Clip Art--Statistics and Probability-- Inferences and Sample Size--10This is part of a collection of math clip art images that show different statistical graphs and concepts, along with some probability concepts. |
|
Data Gathering |
Math Clip Art--Statistics and Probability-- Inferences and Sample Size--11 |
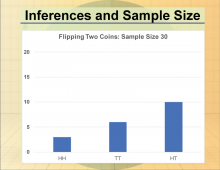
Math Clip Art--Statistics and Probability-- Inferences and Sample Size--11This is part of a collection of math clip art images that show different statistical graphs and concepts, along with some probability concepts. |
|
Data Gathering |
Math Clip Art--Statistics and Probability-- Inferences and Sample Size--12 |
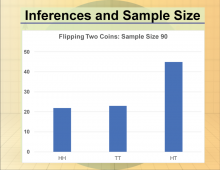
Math Clip Art--Statistics and Probability-- Inferences and Sample Size--12This is part of a collection of math clip art images that show different statistical graphs and concepts, along with some probability concepts. |
|
Data Gathering |
Math Clip Art--Statistics and Probability-- Inferences and Sample Size--9 |
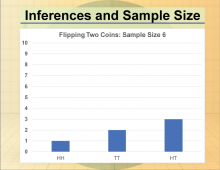
Math Clip Art--Statistics and Probability-- Inferences and Sample Size--9This is part of a collection of math clip art images that show different statistical graphs and concepts, along with some probability concepts. |
|
Data Gathering |
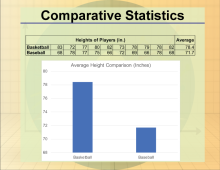
Math Clip Art--Statistics--Comparative Statistic--02 |
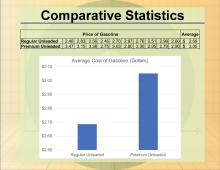
Math Clip Art--Statistics--Comparative Statistic--02This is part of a collection of math clip art images that show different statistical graphs and concepts, along with some probability concepts. |
|
Data Analysis |
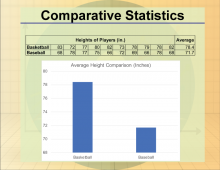
Math Clip Art--Statistics--Comparative Statistics--01 |
Math Clip Art--Statistics--Comparative Statistics--01This is part of a collection of math clip art images that show different statistical graphs and concepts, along with some probability concepts. |
|
Data Analysis |
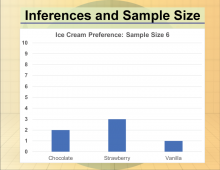
Math Clip Art--Statistics--Inferences and Sample Size--01 |
Math Clip Art--Statistics--Inferences and Sample Size--01This is part of a collection of math clip art images that show different statistical graphs and concepts, along with some probability concepts. |
|
Data Gathering |
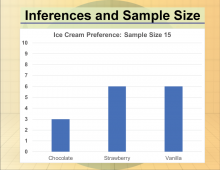
Math Clip Art--Statistics--Inferences and Sample Size--02 |
Math Clip Art--Statistics--Inferences and Sample Size--02This is part of a collection of math clip art images that show different statistical graphs and concepts, along with some probability concepts. |
|
Data Gathering |
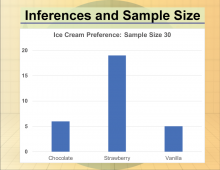
Math Clip Art--Statistics--Inferences and Sample Size--03 |
Math Clip Art--Statistics--Inferences and Sample Size--03This is part of a collection of math clip art images that show different statistical graphs and concepts, along with some probability concepts. |
|
Data Gathering |
Math Clip Art--Statistics--Inferences and Sample Size--04 |
Math Clip Art--Statistics--Inferences and Sample Size--04This is part of a collection of math clip art images that show different statistical graphs and concepts, along with some probability concepts. |
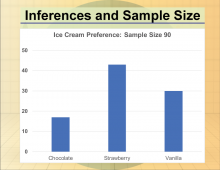
|
Data Gathering |
Math Clip Art--Statistics--Inferences and Sample Size--05 |
Math Clip Art--Statistics--Inferences and Sample Size--05This is part of a collection of math clip art images that show different statistical graphs and concepts, along with some probability concepts. |
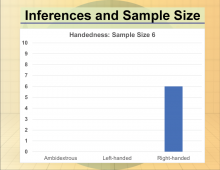
|
Data Gathering |
Math Clip Art--Statistics--Inferences and Sample Size--06 |
Math Clip Art--Statistics--Inferences and Sample Size--06This is part of a collection of math clip art images that show different statistical graphs and concepts, along with some probability concepts. |
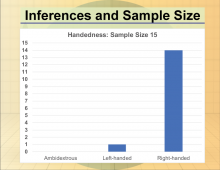
|
Data Gathering |
Math Clip Art--Statistics--Inferences and Sample Size--07 |
Math Clip Art--Statistics--Inferences and Sample Size--07This is part of a collection of math clip art images that show different statistical graphs and concepts, along with some probability concepts. |
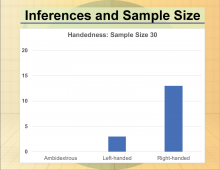
|
Data Gathering |
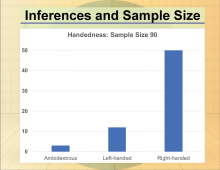
Math Clip Art--Statistics--Inferences and Sample Size--08 |
Math Clip Art--Statistics--Inferences and Sample Size--08This is part of a collection of math clip art images that show different statistical graphs and concepts, along with some probability concepts. |
|
Data Gathering |
Math in the News: Issue 100--Late Night TV Ratings |
Math in the News: Issue 100--Late Night TV RatingsJuly 2014. In this issue of Math in the News we look at the mathematics of the Nielsen Ratings. This provides an excellent application of ratios, proportions, and percents. |

|
Data Analysis |
Math in the News: Issue 113--Olympic Power |
Math in the News: Issue 113--Olympic PowerNovember 2016. In this issue of Math in the News, we look at the history of the Olympics. |

|
Data Analysis |
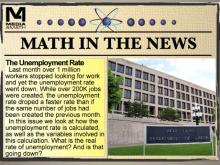
Math in the News: Issue 46--The Unemployment Rate |
Math in the News: Issue 46--The Unemployment RateFebruary 2012. In this issue we look at unemployment statistics from the Bureau of Labor Statistics. |
|
Data Analysis |
Math in the News: Issue 95--The Iditarod Race |
Math in the News: Issue 95--The Iditarod RaceMarch 2014. In this issue of Math in the News we look at the Iditarod Race in Alaska. This gives us an opportunity to analyze data on average speed. We look at data in tables and line graphs and analyze the winning speeds over the history of the race. |
|
Data Analysis |

