Skip to content

Media4Math Library

  • Home
  • Search
  • Subscribe
  • Content
    Newest Resources Free Resources Content Showcase Review Topics SAT Test Prep Blog Training Videos
  • Standards
    CCSS Standards (K-12) TEKS (K-5) TEKS (6-12) NYS (K-5) NYS (6-8) NYS (9-12) FL (K-5) FL (6-8) FL (9-12)
  • Getting Started
    Educators Tutors Parents
  • Funding
    Donors Choose
  • Partners
  • Classroom
  • Log in

FL

These are the resources that support this Florida Standard.

MAFS.4.MD.2.4: Make a line plot to display a data set of measurements in fractions of a unit (1/2, 1/4, 1/8). Solve problems involving addition and subtraction of fractions by using information presented in line plots. For example, from a line plot find and interpret the difference in length between the longest and shortest specimens in an insect collection.

There are 34 resources.
Title Description Thumbnail Image Curriculum Topics

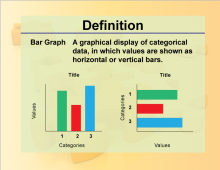
Definition--Charts and Graphs--Bar Graph

This is a collection of definitions related to the concept of charts, graphs, and data displays.

Note: The download is a PNG file.

Related Resources

To see additional resources on this topic, click on the Related Resources tab.

Create a Slide Show

Subscribers can use Slide Show Creator to create a s

Definition--Charts and Graphs--Bar Graph Data Analysis

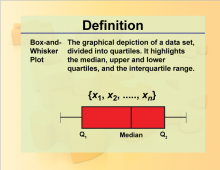
Definition--Charts and Graphs--Box-and-Whisker Plot

This is a collection of definitions related to the concept of charts, graphs, and data displays.

Note: The download is a PNG file.

Related Resources

To see additional resources on this topic, click on the Related Resources tab.

Create a Slide Show

Subscribers can use Slide Show Creator to create a s

Definition--Charts and Graphs--Box-and-Whisker Plot Data Analysis

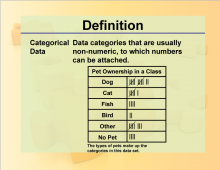
Definition--Charts and Graphs--Categorical Data

This is a collection of definitions related to the concept of charts, graphs, and data displays.

Note: The download is a PNG file.

Related Resources

To see additional resources on this topic, click on the Related Resources tab.

Create a Slide Show

Subscribers can use Slide Show Creator to create a s

Definition--Charts and Graphs--Categorical Data Data Analysis

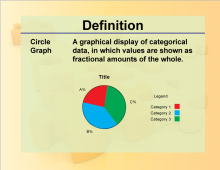
Definition--Charts and Graphs--Circle Graph

This is a collection of definitions related to the concept of charts, graphs, and data displays.

Note: The download is a PNG file.

Related Resources

To see additional resources on this topic, click on the Related Resources tab.

Create a Slide Show

Subscribers can use Slide Show Creator to create a s

Definition--Charts and Graphs--Circle Graph Data Analysis

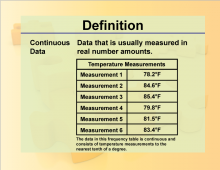
Definition--Charts and Graphs--Continuous Data

This is a collection of definitions related to the concept of charts, graphs, and data displays.

Note: The download is a PNG file.

Related Resources

To see additional resources on this topic, click on the Related Resources tab.

Create a Slide Show

Subscribers can use Slide Show Creator to create a s

Definition--Charts and Graphs--Continuous Data Data Analysis

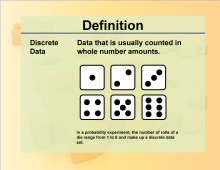
Definition--Charts and Graphs--Discrete Data

This is a collection of definitions related to the concept of charts, graphs, and data displays.

Note: The download is a PNG file.

Related Resources

To see additional resources on this topic, click on the Related Resources tab.

Create a Slide Show

Subscribers can use Slide Show Creator to create a s

Definition--Charts and Graphs--Discrete Data Data Analysis

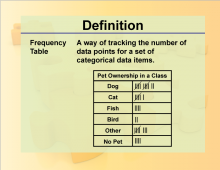
Definition--Charts and Graphs--Frequency Table

This is a collection of definitions related to the concept of charts, graphs, and data displays.

Note: The download is a PNG file.

Related Resources

To see additional resources on this topic, click on the Related Resources tab.

Create a Slide Show

Subscribers can use Slide Show Creator to create a s

Definition--Charts and Graphs--Frequency Table Data Analysis

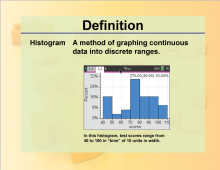
Definition--Charts and Graphs--Histogram

This is a collection of definitions related to the concept of charts, graphs, and data displays.

Note: The download is a PNG file.

Related Resources

To see additional resources on this topic, click on the Related Resources tab.

Create a Slide Show

Subscribers can use Slide Show Creator to create a s

Definition--Charts and Graphs--Histogram Data Analysis

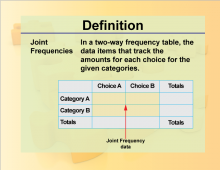
Definition--Charts and Graphs--Joint Frequencies

This is a collection of definitions related to the concept of charts, graphs, and data displays.

Note: The download is a PNG file.

Related Resources

To see additional resources on this topic, click on the Related Resources tab.

Create a Slide Show

Subscribers can use Slide Show Creator to create a s

Definition--Charts and Graphs--Joint Frequencies Data Analysis

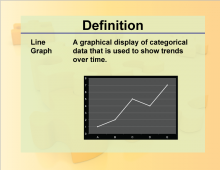
Definition--Charts and Graphs--Line Graph

This is a collection of definitions related to the concept of charts, graphs, and data displays.

Note: The download is a PNG file.

Related Resources

To see additional resources on this topic, click on the Related Resources tab.

Create a Slide Show

Subscribers can use Slide Show Creator to create a s

Definition--Charts and Graphs--Line Graph Data Analysis

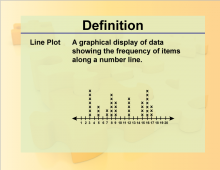
Definition--Charts and Graphs--Line Plot

This is a collection of definitions related to the concept of charts, graphs, and data displays.

Note: The download is a PNG file.

Related Resources

To see additional resources on this topic, click on the Related Resources tab.

Create a Slide Show

Subscribers can use Slide Show Creator to create a s

Definition--Charts and Graphs--Line Plot Data Analysis

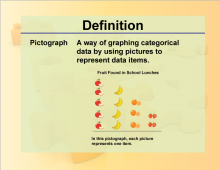
Definition--Charts and Graphs--Pictograph

This is a collection of definitions related to the concept of charts, graphs, and data displays.

Note: The download is a PNG file.

Related Resources

To see additional resources on this topic, click on the Related Resources tab.

Create a Slide Show

Subscribers can use Slide Show Creator to create a s

Definition--Charts and Graphs--Pictograph Data Analysis

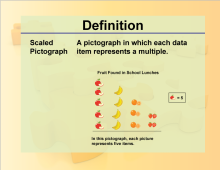
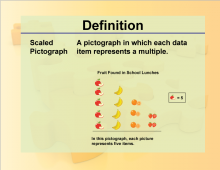
Definition--Charts and Graphs--Scaled Pictograph

This is a collection of definitions related to the concept of charts, graphs, and data displays.

Note: The download is a PNG file.

Related Resources

To see additional resources on this topic, click on the Related Resources tab.

Create a Slide Show

Subscribers can use Slide Show Creator to create a s

Definition--Charts and Graphs--Scaled Pictograph Data Analysis

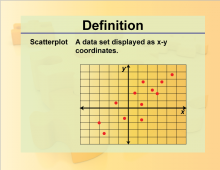
Definition--Charts and Graphs--Scatterplot

This is a collection of definitions related to the concept of charts, graphs, and data displays.

Note: The download is a PNG file.

Related Resources

To see additional resources on this topic, click on the Related Resources tab.

Create a Slide Show

Subscribers can use Slide Show Creator to create a s

Definition--Charts and Graphs--Scatterplot Data Analysis

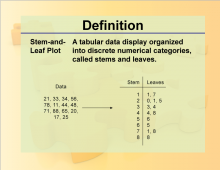
Definition--Charts and Graphs--Stem-and-Leaf Plot

This is a collection of definitions related to the concept of charts, graphs, and data displays.

Note: The download is a PNG file.

Related Resources

To see additional resources on this topic, click on the Related Resources tab.

Create a Slide Show

Subscribers can use Slide Show Creator to create a s

Definition--Charts and Graphs--Stem-and-Leaf Plot Data Analysis

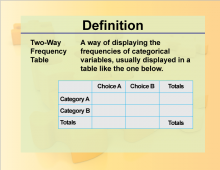
Definition--Charts and Graphs--Two-Way Frequency Table

This is a collection of definitions related to the concept of charts, graphs, and data displays.

Note: The download is a PNG file.

Related Resources

To see additional resources on this topic, click on the Related Resources tab.

Create a Slide Show

Subscribers can use Slide Show Creator to create a s

Definition--Charts and Graphs--Two-Way Frequency Table Data Analysis

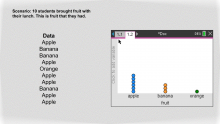
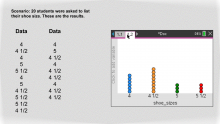
Math Clip Art--Statistics--Line Plots with Data--01

This is part of a collection of math clip art images that show different statistical graphs and concepts.

Note: The download is a PNG file.

Related Resources

To see additional resources on this topic, click on the Related Resources tab.

Create a Slide Show

Subscribers can use Slide Show Creator to c

Math Clip Art--Statistics--Line Plots with Data, Image 1 Data Analysis

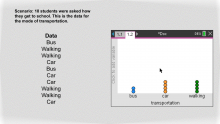
Math Clip Art--Statistics--Line Plots with Data--02

This is part of a collection of math clip art images that show different statistical graphs and concepts.

Note: The download is a PNG file.

Related Resources

To see additional resources on this topic, click on the Related Resources tab.

Create a Slide Show

Subscribers can use Slide Show Creator to c

Math Clip Art--Statistics--Line Plots with Data, Image 2 Data Analysis

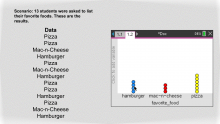
Math Clip Art--Statistics--Line Plots with Data--03

This is part of a collection of math clip art images that show different statistical graphs and concepts.

Note: The download is a PNG file.

Related Resources

To see additional resources on this topic, click on the Related Resources tab.

Create a Slide Show

Subscribers can use Slide Show Creator to c

Math Clip Art--Statistics--Line Plots with Data, Image 3 Data Analysis

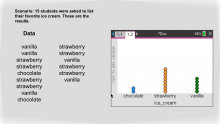
Math Clip Art--Statistics--Line Plots with Data--04

This is part of a collection of math clip art images that show different statistical graphs and concepts.

Note: The download is a PNG file.

Related Resources

To see additional resources on this topic, click on the Related Resources tab.

Create a Slide Show

Subscribers can use Slide Show Creator to c

Math Clip Art--Statistics--Line Plots with Data, Image 4 Data Analysis

Math Clip Art--Statistics--Line Plots with Data--05

This is part of a collection of math clip art images that show different statistical graphs and concepts.

Note: The download is a PNG file.

Related Resources

To see additional resources on this topic, click on the Related Resources tab.

Create a Slide Show

Subscribers can use Slide Show Creator to c

Math Clip Art--Statistics--Line Plots with Data, Image 5 Data Analysis

Math Clip Art--Statistics--Line Plots with Data--06

This is part of a collection of math clip art images that show different statistical graphs and concepts.

Note: The download is a PNG file.

Related Resources

To see additional resources on this topic, click on the Related Resources tab.

Create a Slide Show

Subscribers can use Slide Show Creator to c

Math Clip Art--Statistics--Line Plots with Data, Image 6 Data Analysis

Math Clip Art--Statistics--Line Plots with Data--07

This is part of a collection of math clip art images that show different statistical graphs and concepts.

Note: The download is a PNG file.

Related Resources

To see additional resources on this topic, click on the Related Resources tab.

Create a Slide Show

Subscribers can use Slide Show Creator to c

Math Clip Art--Statistics--Line Plots with Data, Image 7 Data Analysis

Math Clip Art--Statistics--Line Plots with Data--08

This is part of a collection of math clip art images that show different statistical graphs and concepts.

Note: The download is a PNG file.

Related Resources

To see additional resources on this topic, click on the Related Resources tab.

Create a Slide Show

Subscribers can use Slide Show Creator to c

Math Clip Art--Statistics--Line Plots with Data, Image 8 Data Analysis

Math Clip Art--Statistics--Line Plots with Data--09

This is part of a collection of math clip art images that show different statistical graphs and concepts.

Note: The download is a PNG file.

Related Resources

To see additional resources on this topic, click on the Related Resources tab.

Create a Slide Show

Subscribers can use Slide Show Creator to c

Math Clip Art--Statistics--Line Plots with Data, Image 9 Data Analysis

Pagination

  • Current page 1
  • Page 2
  • Next page ››

Extreme Bargains! Over 400 items that are UP TO 70% OFF retail prices!

Up to 90% Off Clearance at Carson Dellosa

Math classroom kits

  • About
  • Privacy Policy
  • Blog
  • Contact Us
  • Accessibility

Follow

Powered by Media4Math

© Media4Math. All rights reserved