
These are the resources that support this Florida Standard.
MAFS.4.MD.2.4: Make a line plot to display a data set of measurements in fractions of a unit (1/2, 1/4, 1/8). Solve problems involving addition and subtraction of fractions by using information presented in line plots. For example, from a line plot find and interpret the difference in length between the longest and shortest specimens in an insect collection.
There are 38 resources.| Title | Description | Thumbnail Image | Curriculum Topics |
|---|---|---|---|
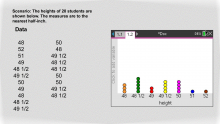
Math Clip Art--Statistics--Line Plots with Data--06 |
Math Clip Art--Statistics--Line Plots with Data--06This is part of a collection of math clip art images that show different statistical graphs and concepts, along with some probability concepts. |
|
Data Analysis |
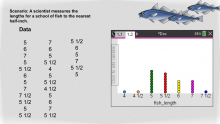
Math Clip Art--Statistics--Line Plots with Data--07 |
Math Clip Art--Statistics--Line Plots with Data--07This is part of a collection of math clip art images that show different statistical graphs and concepts, along with some probability concepts. |
|
Data Analysis |
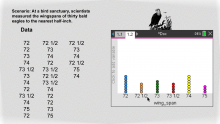
Math Clip Art--Statistics--Line Plots with Data--08 |
Math Clip Art--Statistics--Line Plots with Data--08This is part of a collection of math clip art images that show different statistical graphs and concepts, along with some probability concepts. |
|
Data Analysis |
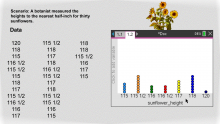
Math Clip Art--Statistics--Line Plots with Data--09 |
Math Clip Art--Statistics--Line Plots with Data--09This is part of a collection of math clip art images that show different statistical graphs and concepts, along with some probability concepts. |
|
Data Analysis |
Math Clip Art--Statistics--Line Plots with Data--10 |
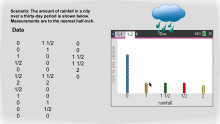
Math Clip Art--Statistics--Line Plots with Data--10This is part of a collection of math clip art images that show different statistical graphs and concepts, along with some probability concepts. |
|
Data Analysis |
Worksheet: Analyzing Line Plots, Worksheet 1 |
Worksheet: Analyzing Line Plots, Worksheet 1This is part of a collection of math worksheets on the topic of constructing and analyzing line plots from a given data set. |

|
Data Analysis |
Worksheet: Analyzing Line Plots, Worksheet 2 |
Worksheet: Analyzing Line Plots, Worksheet 2This is part of a collection of math worksheets on the topic of constructing and analyzing line plots from a given data set. |

|
Data Analysis |
Worksheet: Analyzing Line Plots, Worksheet 3 |
Worksheet: Analyzing Line Plots, Worksheet 3This is part of a collection of math worksheets on the topic of constructing and analyzing line plots from a given data set. |

|
Data Analysis |
Worksheet: Analyzing Line Plots, Worksheet 4 |
Worksheet: Analyzing Line Plots, Worksheet 4This is part of a collection of math worksheets on the topic of constructing and analyzing line plots from a given data set. |

|
Data Analysis |
Worksheet: Analyzing Line Plots, Worksheet 5 |
Worksheet: Analyzing Line Plots, Worksheet 5This is part of a collection of math worksheets on the topic of constructing and analyzing line plots from a given data set. |

|
Data Analysis |
Worksheet: Line Plots from Data, Worksheet 1 |
Worksheet: Line Plots from Data, Worksheet 1This is part of a collection of math worksheets on the topic of line plots. |

|
Length |
Worksheet: Line Plots from Data, Worksheet 2 |
Worksheet: Line Plots from Data, Worksheet 2This is part of a collection of math worksheets on the topic of line plots. |

|
Length |
Worksheet: Line Plots from Data, Worksheet 3 |
Worksheet: Line Plots from Data, Worksheet 3This is part of a collection of math worksheets on the topic of line plots. |

|
Length |

