
These are the resources that support this Florida Standard.
MAFS.3.MD.2.3: Draw a scaled picture graph and a scaled bar graph to represent a data set with several categories. Solve one- and two-step “how many more” and “how many less” problems using information presented in scaled bar graphs. For example, draw a bar graph in which each square in the bar graph might represent 5 pets.
There are 23 resources.| Title | Description | Thumbnail Image | Curriculum Topics |
|---|---|---|---|
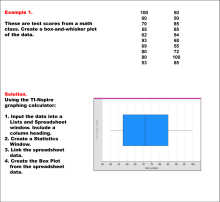
Math Examples Collection: Charts, Graphs, and Plots |
|
Slope-Intercept Form, Data Analysis, Point-Slope Form and Subtraction Facts to 100 | |
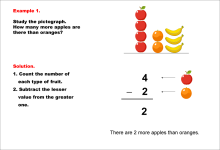
Math Examples Collection: Reading Scaled Graphs |
|
Subtraction Facts to 100 and Data Analysis | |
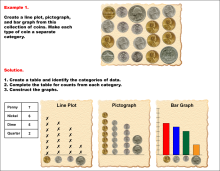
Math Examples Collection: Graphs From Categorical Data |
Overview |
|
Data Analysis |
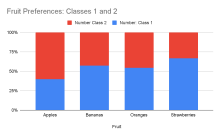
Instructional Resource--Segmented Bar Graphs |
Instructional Resource | Constructing a Segmented Bar GraphThis tutorial goes over the construction of a segmented bar graph, along with how it differs from other chart types. |
|
Data Analysis |
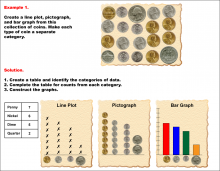
Math Example--Charts, Graphs, and Plots--Graphs of Categorical Data--Example 1 |
Math Example--Charts, Graphs, and Plots-- Graphs of Categorical Data--Example 1In this set of math examples, analyze the behavior of different scatterplots. This includes linear and quadratic models. |
|
Data Analysis |
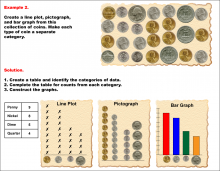
Math Example--Charts, Graphs, and Plots--Graphs of Categorical Data--Example 2 |
Math Example--Charts, Graphs, and Plots-- Graphs of Categorical Data--Example 2In this set of math examples, analyze the behavior of different scatterplots. This includes linear and quadratic models. |
|
Data Analysis |
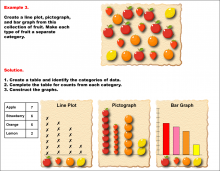
Math Example--Charts, Graphs, and Plots--Graphs of Categorical Data--Example 3 |
Math Example--Charts, Graphs, and Plots-- Graphs of Categorical Data--Example 3In this set of math examples, analyze the behavior of different scatterplots. This includes linear and quadratic models. |
|
Data Analysis |
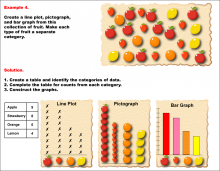
Math Example--Charts, Graphs, and Plots--Graphs of Categorical Data--Example 4 |
Math Example--Charts, Graphs, and Plots-- Graphs of Categorical Data--Example 4In this set of math examples, analyze the behavior of different scatterplots. This includes linear and quadratic models. |
|
Data Analysis |
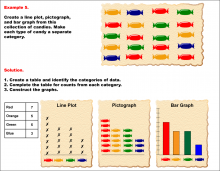
Math Example--Charts, Graphs, and Plots--Graphs of Categorical Data--Example 5 |
Math Example--Charts, Graphs, and Plots-- Graphs of Categorical Data--Example 5In this set of math examples, analyze the behavior of different scatterplots. This includes linear and quadratic models. |
|
Data Analysis |
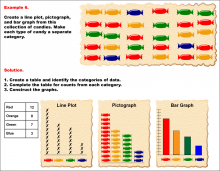
Math Example--Charts, Graphs, and Plots--Graphs of Categorical Data--Example 6 |
Math Example--Charts, Graphs, and Plots-- Graphs of Categorical Data--Example 6In this set of math examples, analyze the behavior of different scatterplots. This includes linear and quadratic models. |
|
Data Analysis |
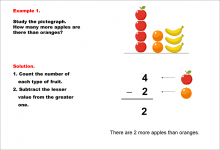
Math Example--Charts, Graphs, and Plots--Reading and Interpreting Scaled Graphs--Example 1 |
Math Example--Charts, Graphs, and Plots-- Reading and Interpreting Scaled Graphs--Example 1In this set of math examples, analyze the behavior of different scatterplots. This includes linear and quadratic models. |
|
Subtraction Facts to 100 and Data Analysis |
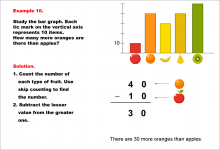
Math Example--Charts, Graphs, and Plots--Reading and Interpreting Scaled Graphs--Example 10 |
Math Example--Charts, Graphs, and Plots-- Reading and Interpreting Scaled Graphs--Example 10In this set of math examples, analyze the behavior of different scatterplots. This includes linear and quadratic models. |
|
Subtraction Facts to 100 and Data Analysis |
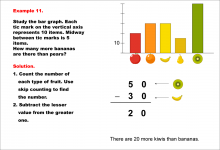
Math Example--Charts, Graphs, and Plots--Reading and Interpreting Scaled Graphs--Example 11 |
Math Example--Charts, Graphs, and Plots-- Reading and Interpreting Scaled Graphs--Example 11In this set of math examples, analyze the behavior of different scatterplots. This includes linear and quadratic models. |
|
Subtraction Facts to 100 and Data Analysis |
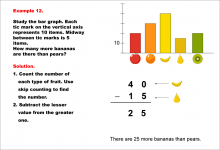
Math Example--Charts, Graphs, and Plots--Reading and Interpreting Scaled Graphs--Example 12 |
Math Example--Charts, Graphs, and Plots-- Reading and Interpreting Scaled Graphs--Example 12In this set of math examples, analyze the behavior of different scatterplots. This includes linear and quadratic models. |
|
Subtraction Facts to 100 and Data Analysis |
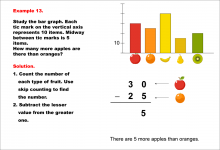
Math Example--Charts, Graphs, and Plots--Reading and Interpreting Scaled Graphs--Example 13 |
Math Example--Charts, Graphs, and Plots-- Reading and Interpreting Scaled Graphs--Example 13In this set of math examples, analyze the behavior of different scatterplots. This includes linear and quadratic models. |
|
Subtraction Facts to 100 and Data Analysis |
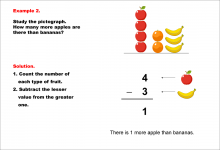
Math Example--Charts, Graphs, and Plots--Reading and Interpreting Scaled Graphs--Example 2 |
Math Example--Charts, Graphs, and Plots-- Reading and Interpreting Scaled Graphs--Example 2In this set of math examples, analyze the behavior of different scatterplots. This includes linear and quadratic models. |
|
Subtraction Facts to 100 and Data Analysis |
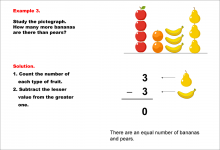
Math Example--Charts, Graphs, and Plots--Reading and Interpreting Scaled Graphs--Example 3 |
Math Example--Charts, Graphs, and Plots-- Reading and Interpreting Scaled Graphs--Example 3In this set of math examples, analyze the behavior of different scatterplots. This includes linear and quadratic models. |
|
Subtraction Facts to 100 and Data Analysis |
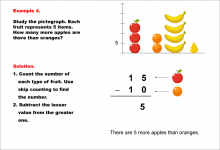
Math Example--Charts, Graphs, and Plots--Reading and Interpreting Scaled Graphs--Example 4 |
Math Example--Charts, Graphs, and Plots-- Reading and Interpreting Scaled Graphs--Example 4In this set of math examples, analyze the behavior of different scatterplots. This includes linear and quadratic models. |
|
Subtraction Facts to 100 and Data Analysis |
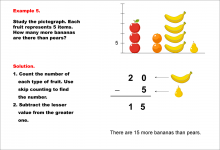
Math Example--Charts, Graphs, and Plots--Reading and Interpreting Scaled Graphs--Example 5 |
Math Example--Charts, Graphs, and Plots-- Reading and Interpreting Scaled Graphs--Example 5In this set of math examples, analyze the behavior of different scatterplots. This includes linear and quadratic models. |
|
Subtraction Facts to 100 and Data Analysis |
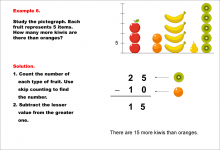
Math Example--Charts, Graphs, and Plots--Reading and Interpreting Scaled Graphs--Example 6 |
Math Example--Charts, Graphs, and Plots-- Reading and Interpreting Scaled Graphs--Example 6In this set of math examples, analyze the behavior of different scatterplots. This includes linear and quadratic models. |
|
Subtraction Facts to 100 and Data Analysis |
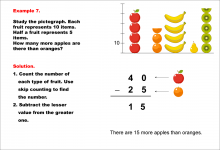
Math Example--Charts, Graphs, and Plots--Reading and Interpreting Scaled Graphs--Example 7 |
Math Example--Charts, Graphs, and Plots-- Reading and Interpreting Scaled Graphs--Example 7In this set of math examples, analyze the behavior of different scatterplots. This includes linear and quadratic models. |
|
Subtraction Facts to 100 and Data Analysis |
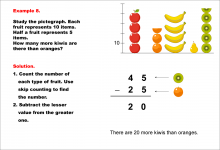
Math Example--Charts, Graphs, and Plots--Reading and Interpreting Scaled Graphs--Example 8 |
Math Example--Charts, Graphs, and Plots-- Reading and Interpreting Scaled Graphs--Example 8In this set of math examples, analyze the behavior of different scatterplots. This includes linear and quadratic models. |
|
Subtraction Facts to 100 and Data Analysis |
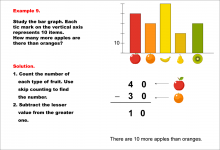
Math Example--Charts, Graphs, and Plots--Reading and Interpreting Scaled Graphs--Example 9 |
Math Example--Charts, Graphs, and Plots-- Reading and Interpreting Scaled Graphs--Example 9In this set of math examples, analyze the behavior of different scatterplots. This includes linear and quadratic models. |
|
Subtraction Facts to 100 and Data Analysis |

