Digital Resources on the Topic of Probability & Statistics
|
|
| Thumbnail Image | Description | |
|---|---|---|
Math Example--Charts, Graphs, and Plots--Analyzing Scatterplots: Example 8 |
|
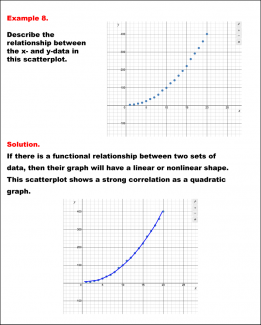
Math Example--Charts, Graphs, and Plots-- Analyzing Scatterplots: Example 8
In this set of math examples, analyze the behavior of different scatterplots. This includes linear and quadratic models. |
Math Example--Charts, Graphs, and Plots--Analyzing Scatterplots: Example 9 |
|
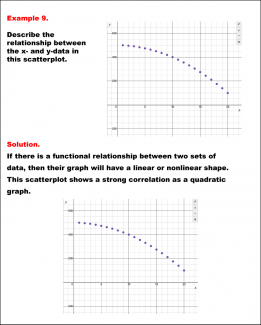
Math Example--Charts, Graphs, and Plots-- Analyzing Scatterplots: Example 9
In this set of math examples, analyze the behavior of different scatterplots. This includes linear and quadratic models. |
Math Example--Charts, Graphs, and Plots--Data Plot--Example 1 |
|
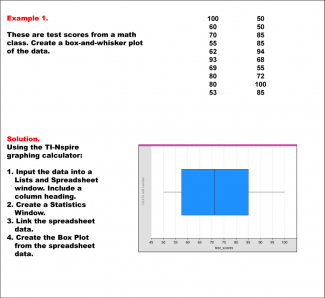
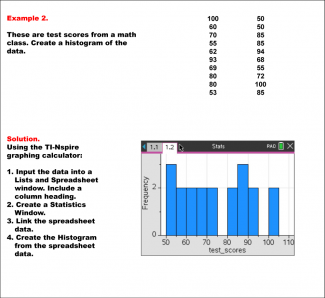
Math Example--Charts, Graphs, and Plots-- Data Plot--Example 1
In this set of math examples, analyze the behavior of different scatterplots. This includes linear and quadratic models. |
Math Example--Charts, Graphs, and Plots--Data Plot--Example 2 |
|
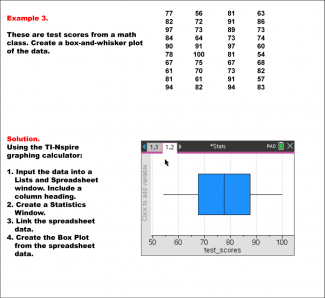
Math Example--Charts, Graphs, and Plots-- Data Plot--Example 2
In this set of math examples, analyze the behavior of different scatterplots. This includes linear and quadratic models. |
Math Example--Charts, Graphs, and Plots--Data Plot--Example 3 |
|
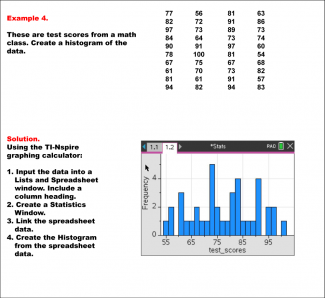
Math Example--Charts, Graphs, and Plots-- Data Plot--Example 3
In this set of math examples, analyze the behavior of different scatterplots. This includes linear and quadratic models. |
Math Example--Charts, Graphs, and Plots--Data Plot--Example 4 |
|
Math Example--Charts, Graphs, and Plots-- Data Plot--Example 4
In this set of math examples, analyze the behavior of different scatterplots. This includes linear and quadratic models. |
Math Example--Charts, Graphs, and Plots--Estimating the Line of Best Fit: Example 1 |
|
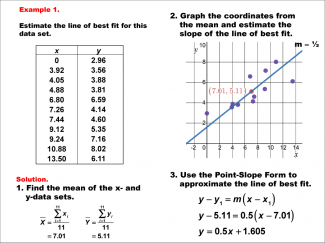
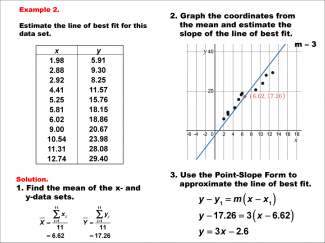
Math Example--Charts, Graphs, and Plots-- Estimating the Line of Best Fit: Example 1
In this set of math examples, analyze the behavior of different scatterplots. This includes linear and quadratic models. |
Math Example--Charts, Graphs, and Plots--Estimating the Line of Best Fit: Example 2 |
|
Math Example--Charts, Graphs, and Plots-- Estimating the Line of Best Fit: Example 2
In this set of math examples, analyze the behavior of different scatterplots. This includes linear and quadratic models. |
Math Example--Charts, Graphs, and Plots--Estimating the Line of Best Fit: Example 3 |
|
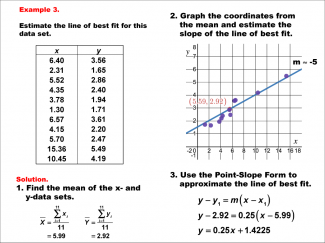
Math Example--Charts, Graphs, and Plots-- Estimating the Line of Best Fit: Example 3
In this set of math examples, analyze the behavior of different scatterplots. This includes linear and quadratic models. |
Math Example--Charts, Graphs, and Plots--Estimating the Line of Best Fit: Example 4 |
|
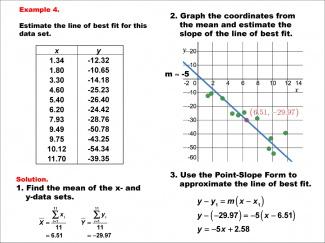
Math Example--Charts, Graphs, and Plots-- Estimating the Line of Best Fit: Example 4
In this set of math examples, analyze the behavior of different scatterplots. This includes linear and quadratic models. |
Math Example--Charts, Graphs, and Plots--Estimating the Line of Best Fit: Example 5 |
|
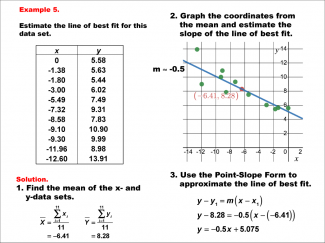
Math Example--Charts, Graphs, and Plots-- Estimating the Line of Best Fit: Example 5
In this set of math examples, analyze the behavior of different scatterplots. This includes linear and quadratic models. |
Math Example--Charts, Graphs, and Plots--Graphs of Categorical Data--Example 1 |
|
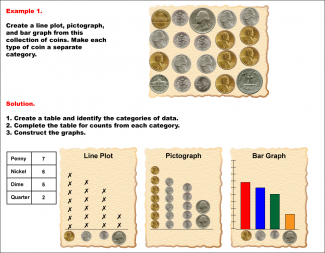
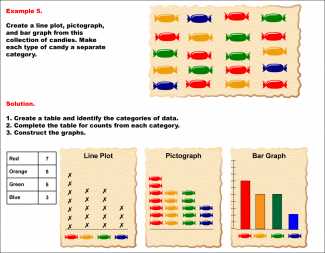
Math Example--Charts, Graphs, and Plots-- Graphs of Categorical Data--Example 1
In this set of math examples, analyze the behavior of different scatterplots. This includes linear and quadratic models. |
Math Example--Charts, Graphs, and Plots--Graphs of Categorical Data--Example 2 |
|
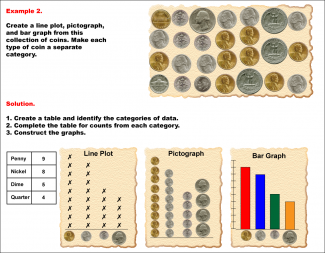
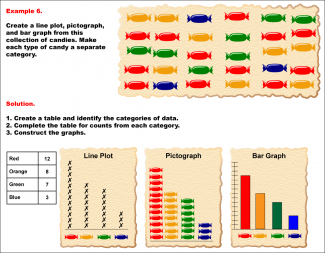
Math Example--Charts, Graphs, and Plots-- Graphs of Categorical Data--Example 2
In this set of math examples, analyze the behavior of different scatterplots. This includes linear and quadratic models. |
Math Example--Charts, Graphs, and Plots--Graphs of Categorical Data--Example 3 |
|
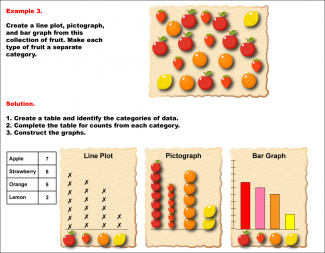
Math Example--Charts, Graphs, and Plots-- Graphs of Categorical Data--Example 3
In this set of math examples, analyze the behavior of different scatterplots. This includes linear and quadratic models. |
Math Example--Charts, Graphs, and Plots--Graphs of Categorical Data--Example 4 |
|
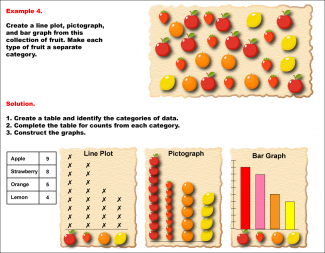
Math Example--Charts, Graphs, and Plots-- Graphs of Categorical Data--Example 4
In this set of math examples, analyze the behavior of different scatterplots. This includes linear and quadratic models. |
Math Example--Charts, Graphs, and Plots--Graphs of Categorical Data--Example 5 |
|
Math Example--Charts, Graphs, and Plots-- Graphs of Categorical Data--Example 5
In this set of math examples, analyze the behavior of different scatterplots. This includes linear and quadratic models. |
Math Example--Charts, Graphs, and Plots--Graphs of Categorical Data--Example 6 |
|
Math Example--Charts, Graphs, and Plots-- Graphs of Categorical Data--Example 6
In this set of math examples, analyze the behavior of different scatterplots. This includes linear and quadratic models. |
Math Example--Charts, Graphs, and Plots--Reading and Interpreting Scaled Graphs--Example 1 |
|
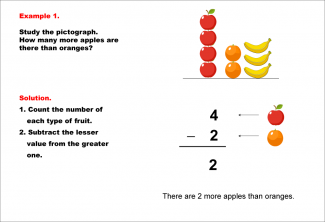
Math Example--Charts, Graphs, and Plots-- Reading and Interpreting Scaled Graphs--Example 1
In this set of math examples, analyze the behavior of different scatterplots. This includes linear and quadratic models. |
Math Example--Charts, Graphs, and Plots--Reading and Interpreting Scaled Graphs--Example 10 |
|
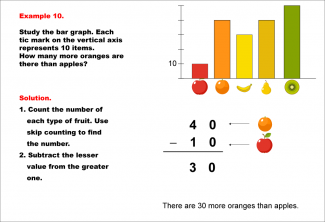
Math Example--Charts, Graphs, and Plots-- Reading and Interpreting Scaled Graphs--Example 10
In this set of math examples, analyze the behavior of different scatterplots. This includes linear and quadratic models. |
Math Example--Charts, Graphs, and Plots--Reading and Interpreting Scaled Graphs--Example 11 |
|
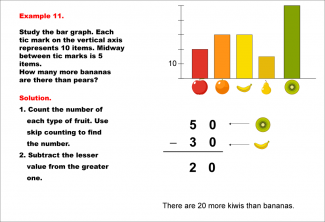
Math Example--Charts, Graphs, and Plots-- Reading and Interpreting Scaled Graphs--Example 11
In this set of math examples, analyze the behavior of different scatterplots. This includes linear and quadratic models. |
Math Example--Charts, Graphs, and Plots--Reading and Interpreting Scaled Graphs--Example 12 |
|
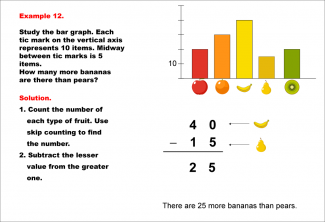
Math Example--Charts, Graphs, and Plots-- Reading and Interpreting Scaled Graphs--Example 12
In this set of math examples, analyze the behavior of different scatterplots. This includes linear and quadratic models. |
Math Example--Charts, Graphs, and Plots--Reading and Interpreting Scaled Graphs--Example 13 |
|
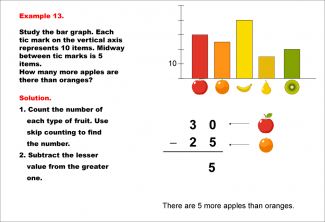
Math Example--Charts, Graphs, and Plots-- Reading and Interpreting Scaled Graphs--Example 13
In this set of math examples, analyze the behavior of different scatterplots. This includes linear and quadratic models. |
Math Example--Charts, Graphs, and Plots--Reading and Interpreting Scaled Graphs--Example 2 |

|
Math Example--Charts, Graphs, and Plots-- Reading and Interpreting Scaled Graphs--Example 2
In this set of math examples, analyze the behavior of different scatterplots. This includes linear and quadratic models. |
Math Example--Charts, Graphs, and Plots--Reading and Interpreting Scaled Graphs--Example 3 |
|
Math Example--Charts, Graphs, and Plots-- Reading and Interpreting Scaled Graphs--Example 3
In this set of math examples, analyze the behavior of different scatterplots. This includes linear and quadratic models. |
Math Example--Charts, Graphs, and Plots--Reading and Interpreting Scaled Graphs--Example 4 |
|
Math Example--Charts, Graphs, and Plots-- Reading and Interpreting Scaled Graphs--Example 4
In this set of math examples, analyze the behavior of different scatterplots. This includes linear and quadratic models. |