
These are the resources that support this North Carolina Standard.
NC.M1.S-ID.7 - Interpret in context the rate of change and the intercept of a linear model. Use the linear model to interpolate and extrapolate predicted values. Assess the validity of a predicted value.
Displaying 1 - 17 of 17 resources:
| Thumbnail Image | Title | Description | Curriculum Nodes |
|---|---|---|---|

|
Math Examples Collection: Analyzing Scatterplots |
This collection aggregates all the math examples around the topic of Analyzing Scatterplots. There are a total of 10 Math Examples. | Data Analysis |
|
Math Examples Collection: Charts, Graphs, and Plots |
This collection aggregates all the math examples around the topic of Charts, Graphs, and Plots. There are a total of 38 Math Examples. This collection of resources is made up of downloadable PNG images that you can easily incorporate into your lesson plans. | Slope-Intercept Form, Data Analysis, Point-Slope Form and Subtraction Facts to 100 |
|
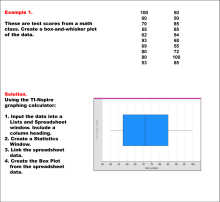
Math Example--Charts, Graphs, and Plots--Analyzing Scatterplots: Example 1 |
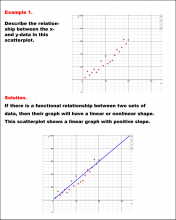
Math Example--Charts, Graphs, and Plots-- Analyzing Scatterplots: Example 1
In this set of math examples, analyze the behavior of different scatterplots. This includes linear and quadratic models. |
Data Analysis |
|
Math Example--Charts, Graphs, and Plots--Analyzing Scatterplots: Example 10 |
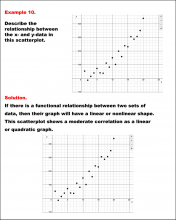
Math Example--Charts, Graphs, and Plots-- Analyzing Scatterplots: Example 10
In this set of math examples, analyze the behavior of different scatterplots. This includes linear and quadratic models. |
Data Analysis |
|
Math Example--Charts, Graphs, and Plots--Analyzing Scatterplots: Example 2 |
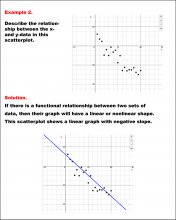
Math Example--Charts, Graphs, and Plots-- Analyzing Scatterplots: Example 2
In this set of math examples, analyze the behavior of different scatterplots. This includes linear and quadratic models. |
Data Analysis |
|
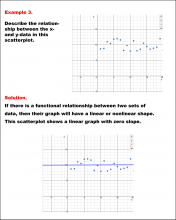
Math Example--Charts, Graphs, and Plots--Analyzing Scatterplots: Example 3 |
Math Example--Charts, Graphs, and Plots-- Analyzing Scatterplots: Example 3
In this set of math examples, analyze the behavior of different scatterplots. This includes linear and quadratic models. |
Data Analysis |
|
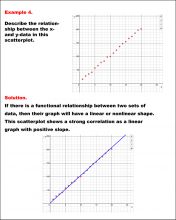
Math Example--Charts, Graphs, and Plots--Analyzing Scatterplots: Example 4 |
Math Example--Charts, Graphs, and Plots-- Analyzing Scatterplots: Example 4
In this set of math examples, analyze the behavior of different scatterplots. This includes linear and quadratic models. |
Data Analysis |
|
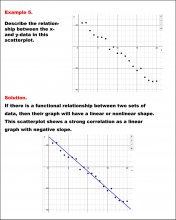
Math Example--Charts, Graphs, and Plots--Analyzing Scatterplots: Example 5 |
Math Example--Charts, Graphs, and Plots-- Analyzing Scatterplots: Example 5
In this set of math examples, analyze the behavior of different scatterplots. This includes linear and quadratic models. |
Data Analysis |
|
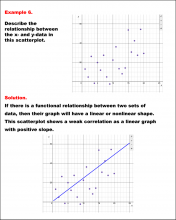
Math Example--Charts, Graphs, and Plots--Analyzing Scatterplots: Example 6 |
Math Example--Charts, Graphs, and Plots-- Analyzing Scatterplots: Example 6
In this set of math examples, analyze the behavior of different scatterplots. This includes linear and quadratic models. |
Data Analysis |
|
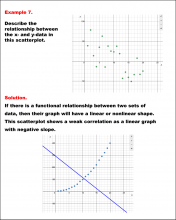
Math Example--Charts, Graphs, and Plots--Analyzing Scatterplots: Example 7 |
Math Example--Charts, Graphs, and Plots-- Analyzing Scatterplots: Example 7
In this set of math examples, analyze the behavior of different scatterplots. This includes linear and quadratic models. |
Data Analysis |
|
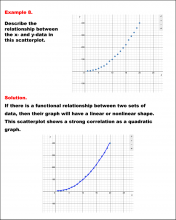
Math Example--Charts, Graphs, and Plots--Analyzing Scatterplots: Example 8 |
Math Example--Charts, Graphs, and Plots-- Analyzing Scatterplots: Example 8
In this set of math examples, analyze the behavior of different scatterplots. This includes linear and quadratic models. |
Data Analysis |
|
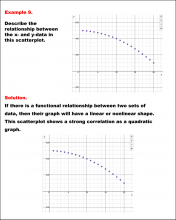
Math Example--Charts, Graphs, and Plots--Analyzing Scatterplots: Example 9 |
Math Example--Charts, Graphs, and Plots-- Analyzing Scatterplots: Example 9
In this set of math examples, analyze the behavior of different scatterplots. This includes linear and quadratic models. |
Data Analysis |
|
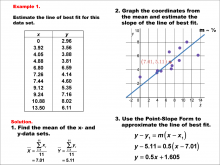
Math Example--Charts, Graphs, and Plots--Estimating the Line of Best Fit: Example 1 |
Math Example--Charts, Graphs, and Plots-- Estimating the Line of Best Fit: Example 1
In this set of math examples, analyze the behavior of different scatterplots. |
Slope-Intercept Form and Data Analysis |
|
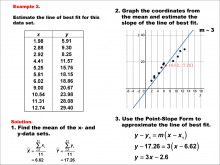
Math Example--Charts, Graphs, and Plots--Estimating the Line of Best Fit: Example 2 |
Math Example--Charts, Graphs, and Plots-- Estimating the Line of Best Fit: Example 2
In this set of math examples, analyze the behavior of different scatterplots. |
Point-Slope Form, Slope-Intercept Form and Data Analysis |
|
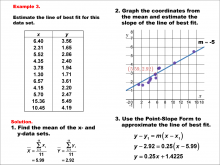
Math Example--Charts, Graphs, and Plots--Estimating the Line of Best Fit: Example 3 |
Math Example--Charts, Graphs, and Plots-- Estimating the Line of Best Fit: Example 3
In this set of math examples, analyze the behavior of different scatterplots. |
Point-Slope Form, Slope-Intercept Form and Data Analysis |
|
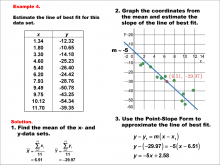
Math Example--Charts, Graphs, and Plots--Estimating the Line of Best Fit: Example 4 |
Math Example--Charts, Graphs, and Plots-- Estimating the Line of Best Fit: Example 4
In this set of math examples, analyze the behavior of different scatterplots. |
Point-Slope Form, Slope-Intercept Form and Data Analysis |
|
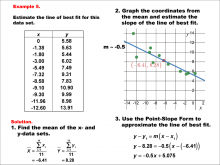
Math Example--Charts, Graphs, and Plots--Estimating the Line of Best Fit: Example 5 |
Math Example--Charts, Graphs, and Plots-- Estimating the Line of Best Fit: Example 5
In this set of math examples, analyze the behavior of different scatterplots. |
Point-Slope Form, Slope-Intercept Form and Data Analysis |