
These are the resources that support this Georgia Standard.
8.FGR.6.4 - Use appropriate graphical displays from data distributions involving lines of best fit to draw informal inferences and answer the statistical investigative question posed in an unbiased statistical study.
Displaying 1 - 15 of 15 resources:
| Thumbnail Image | Title | Description | Curriculum Nodes |
|---|---|---|---|
|
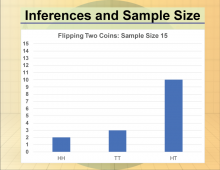
Math Clip Art--Statistics and Probability-- Inferences and Sample Size--10 |
Math Clip Art--Statistics and Probability-- Inferences and Sample Size--10
This is part of a collection of math clip art images that show different statistical graphs and concepts, along with some probability |
Data Gathering |
|
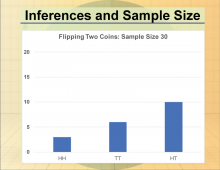
Math Clip Art--Statistics and Probability-- Inferences and Sample Size--11 |
Math Clip Art--Statistics and Probability-- Inferences and Sample Size--11
This is part of a collection of math clip art images that show different statistical graphs and concepts, along with some probability |
Data Gathering |
|
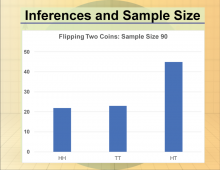
Math Clip Art--Statistics and Probability-- Inferences and Sample Size--12 |
Math Clip Art--Statistics and Probability-- Inferences and Sample Size--12
This is part of a collection of math clip art images that show different statistical graphs and concepts, along with some probability |
Data Gathering |
|
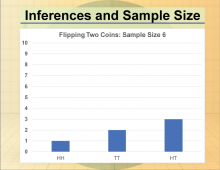
Math Clip Art--Statistics and Probability-- Inferences and Sample Size--9 |
Math Clip Art--Statistics and Probability-- Inferences and Sample Size--9
This is part of a collection of math clip art images that show different statistical graphs and concepts, along with some probability |
Data Gathering |
|
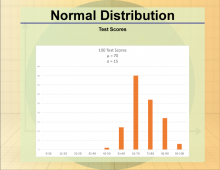
Math Clip Art--Statistics--Normal Distribution--01 |
Math Clip Art--Statistics--Normal Distribution--01
This is part of a collection of math clip art images that show different statistical graphs and concepts, along with some probability concepts. |
Probability |
|
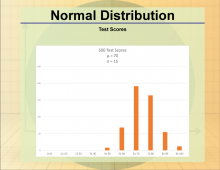
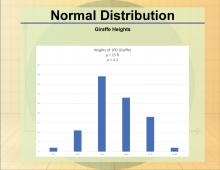
Math Clip Art--Statistics--Normal Distribution--02 |
Math Clip Art--Statistics--Normal Distribution--02
This is part of a collection of math clip art images that show different statistical graphs and concepts, along with some probability concepts. |
Probability |
|
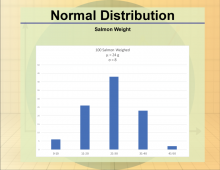
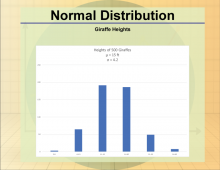
Math Clip Art--Statistics--Normal Distribution--03 |
Math Clip Art--Statistics--Normal Distribution--03
This is part of a collection of math clip art images that show different statistical graphs and concepts, along with some probability concepts. |
Probability |
|
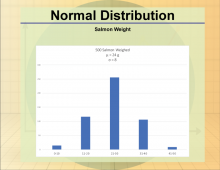
Math Clip Art--Statistics--Normal Distribution--04 |
Math Clip Art--Statistics--Normal Distribution--04
This is part of a collection of math clip art images that show different statistical graphs and concepts, along with some probability concepts. |
Probability |
|
Math Clip Art--Statistics--Normal Distribution--05 |
Math Clip Art--Statistics--Normal Distribution--05
This is part of a collection of math clip art images that show different statistical graphs and concepts, along with some probability concepts. |
Probability |
|
Math Clip Art--Statistics--Normal Distribution--06 |
Math Clip Art--Statistics--Normal Distribution--06
This is part of a collection of math clip art images that show different statistical graphs and concepts, along with some probability concepts. |
Probability |
|
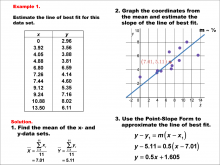
Math Example--Charts, Graphs, and Plots--Estimating the Line of Best Fit: Example 1 |
Math Example--Charts, Graphs, and Plots-- Estimating the Line of Best Fit: Example 1
In this set of math examples, analyze the behavior of different scatterplots. |
Slope-Intercept Form and Data Analysis |
|
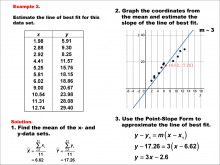
Math Example--Charts, Graphs, and Plots--Estimating the Line of Best Fit: Example 2 |
Math Example--Charts, Graphs, and Plots-- Estimating the Line of Best Fit: Example 2
In this set of math examples, analyze the behavior of different scatterplots. |
Point-Slope Form, Slope-Intercept Form and Data Analysis |
|
Math Example--Charts, Graphs, and Plots--Estimating the Line of Best Fit: Example 3 |
Math Example--Charts, Graphs, and Plots-- Estimating the Line of Best Fit: Example 3
In this set of math examples, analyze the behavior of different scatterplots. |
Point-Slope Form, Slope-Intercept Form and Data Analysis |
|
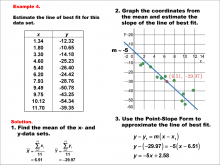
Math Example--Charts, Graphs, and Plots--Estimating the Line of Best Fit: Example 4 |
Math Example--Charts, Graphs, and Plots-- Estimating the Line of Best Fit: Example 4
In this set of math examples, analyze the behavior of different scatterplots. |
Point-Slope Form, Slope-Intercept Form and Data Analysis |
|
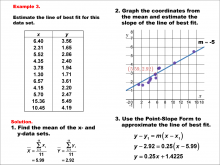
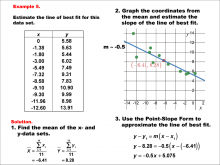
Math Example--Charts, Graphs, and Plots--Estimating the Line of Best Fit: Example 5 |
Math Example--Charts, Graphs, and Plots-- Estimating the Line of Best Fit: Example 5
In this set of math examples, analyze the behavior of different scatterplots. |
Point-Slope Form, Slope-Intercept Form and Data Analysis |