
These are the resources that support this NYS Standard.
NY-AII-S.ID.6: Represent bivariate data on a scatter plot, and describe how the variables’ values are related.
There are 37 resources.| Title | Description | Thumbnail Image | Curriculum Topics |
|---|---|---|---|
Math in the News Collection: Applications of Data Analysis |
This is a collection of Math in the News stories that focus on the topic of Data Analysis. | 
|
Data Analysis, Data Gathering, Probability, Percents and Ratios and Rates |
Math Examples Collection: Analyzing Scatterplots |
This collection aggregates all the math examples around the topic of Analyzing Scatterplots. There are a total of 10 Math Examples. | 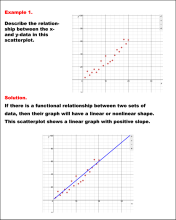
|
Data Analysis |
Math Examples Collection: Linear Data Models |
Overview This collThis collection aggregates all the math examples around the topic of Linear Data Models. There are a total of 4 Math Examples. | 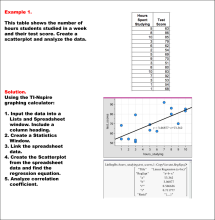
|
Data Analysis |
Math Video Collection: Texas Instruments Tutorial Videos |
Overview This colleThis collection aggregates all the math videos and resources in this series: Texas Instruments Tutorial Videos. There are a total of 266 resources. | 
|
Rational Expressions, Sequences, Series, Polynomial Functions and Equations, Graphs of Quadratic Functions, Quadratic Equations and Functions, Solving Systems of Equations, Trig Expressions and Identities, Probability, Geometric Constructions with Triangles, Composite Functions, Geometric Constructions with Angles and Planes, Distance Formula, Data Analysis, Slope, Special Functions, Trigonometric Functions, Graphs of Exponential and Logarithmic Functions, Radical Functions and Equations, Rational Functions and Equations, Slope-Intercept Form, Coordinate Systems, Graphs of Linear Functions, Inequalities, Matrix Operations and Midpoint Formula |
Math Definitions Collection: Statistics and Probability |
This collection aggregates all the definition image cards around the topic of Statistics and Probability terms and vocabulary. There are a total of 34 terms. | 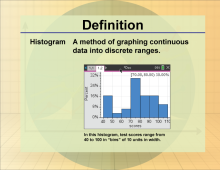
|
Data Analysis, Probability and Data Gathering |
Math Examples Collection: Charts, Graphs, and Plots |
This collection aggregates all the math examples around the topic of Charts, Graphs, and Plots. There are a total of 38 Math Examples. This collection of resources is made up of downloadable PNG images that you can easily incorporate into your lesson plans. | 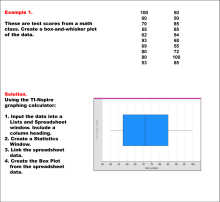
|
Slope-Intercept Form, Data Analysis, Point-Slope Form and Subtraction Facts to 100 |
Closed Captioned Video: Multiseries Scatterplot |
Closed Captioned Video: Multiseries Scatterplot
In this TI Nspire tutorial, Spreadsheet and Graph windows are used to graph a multiseries scatterplot. This video supports the TI-Nspire Clickpad and Touchpad. This Mini-Tutorial Video includes a worksheet. |

|
Data Analysis |
Closed Captioned Video: Scatterplot 1 |
Closed Captioned Video: Scatterplot 1
In this TI Nspire tutorial, Spreadsheet and Graph windows are used to graph a scatterplot. This video supports the TI-Nspire Clickpad and Touchpad. This Mini-Tutorial Video includes a worksheet. |

|
Data Analysis |
Closed Captioned Video: Scatterplot 2 |
Closed Captioned Video: Scatterplot 2
In this TI Nspire tutorial, Spreadsheet and Statistics windows are used to graph a scatterplot. This video supports the TI-Nspire Clickpad and Touchpad. This Mini-Tutorial Video includes a worksheet. |
|
Data Analysis |
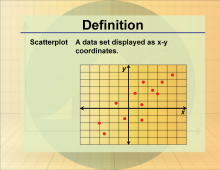
Definition--Statistics and Probability Concepts--Scatterplot |
Definition--Statistics and Probability Concepts--Scatterplot
This is part of a collection of definitions on the topic of probability and statistics. Each definition includes an example of the term. |
|
Data Analysis |
INSTRUCTIONAL RESOURCE: Nspire App Tutorial: Graphing a Scatterplot |
In this Slide Show, learn how graph data in a scatterplot using the graph window. This presentation requires the use of the TI-Nspire iPad App. Note: the download is a PPT. |

|
Graphs of Linear Functions, Slope-Intercept Form and Data Analysis |
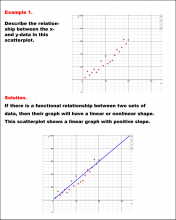
Math Example--Charts, Graphs, and Plots--Analyzing Scatterplots: Example 1 |
Math Example--Charts, Graphs, and Plots-- Analyzing Scatterplots: Example 1
In this set of math examples, analyze the behavior of different scatterplots. This includes linear and quadratic models. |
|
Data Analysis |
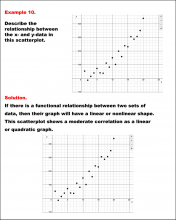
Math Example--Charts, Graphs, and Plots--Analyzing Scatterplots: Example 10 |
Math Example--Charts, Graphs, and Plots-- Analyzing Scatterplots: Example 10
In this set of math examples, analyze the behavior of different scatterplots. This includes linear and quadratic models. |
|
Data Analysis |
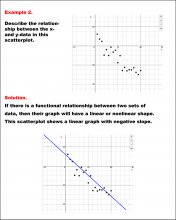
Math Example--Charts, Graphs, and Plots--Analyzing Scatterplots: Example 2 |
Math Example--Charts, Graphs, and Plots-- Analyzing Scatterplots: Example 2
In this set of math examples, analyze the behavior of different scatterplots. This includes linear and quadratic models. |
|
Data Analysis |
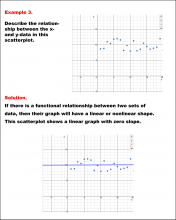
Math Example--Charts, Graphs, and Plots--Analyzing Scatterplots: Example 3 |
Math Example--Charts, Graphs, and Plots-- Analyzing Scatterplots: Example 3
In this set of math examples, analyze the behavior of different scatterplots. This includes linear and quadratic models. |
|
Data Analysis |
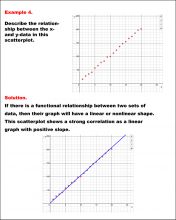
Math Example--Charts, Graphs, and Plots--Analyzing Scatterplots: Example 4 |
Math Example--Charts, Graphs, and Plots-- Analyzing Scatterplots: Example 4
In this set of math examples, analyze the behavior of different scatterplots. This includes linear and quadratic models. |
|
Data Analysis |
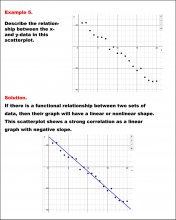
Math Example--Charts, Graphs, and Plots--Analyzing Scatterplots: Example 5 |
Math Example--Charts, Graphs, and Plots-- Analyzing Scatterplots: Example 5
In this set of math examples, analyze the behavior of different scatterplots. This includes linear and quadratic models. |
|
Data Analysis |
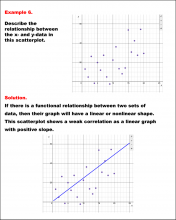
Math Example--Charts, Graphs, and Plots--Analyzing Scatterplots: Example 6 |
Math Example--Charts, Graphs, and Plots-- Analyzing Scatterplots: Example 6
In this set of math examples, analyze the behavior of different scatterplots. This includes linear and quadratic models. |
|
Data Analysis |
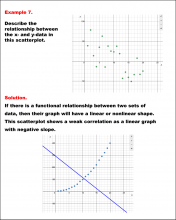
Math Example--Charts, Graphs, and Plots--Analyzing Scatterplots: Example 7 |
Math Example--Charts, Graphs, and Plots-- Analyzing Scatterplots: Example 7
In this set of math examples, analyze the behavior of different scatterplots. This includes linear and quadratic models. |
|
Data Analysis |
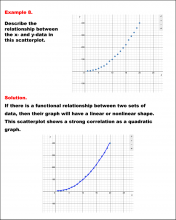
Math Example--Charts, Graphs, and Plots--Analyzing Scatterplots: Example 8 |
Math Example--Charts, Graphs, and Plots-- Analyzing Scatterplots: Example 8
In this set of math examples, analyze the behavior of different scatterplots. This includes linear and quadratic models. |
|
Data Analysis |
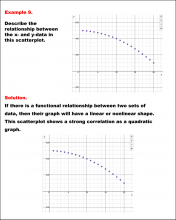
Math Example--Charts, Graphs, and Plots--Analyzing Scatterplots: Example 9 |
Math Example--Charts, Graphs, and Plots-- Analyzing Scatterplots: Example 9
In this set of math examples, analyze the behavior of different scatterplots. This includes linear and quadratic models. |
|
Data Analysis |
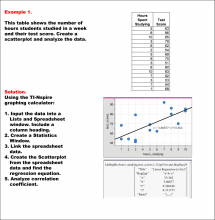
Math Example--Linear Function Concepts--Linear Data Model: Example 1 |
Math Example--Linear Function Concepts--Linear Data Model: Example 1
This is part of a collection of math examples that focus on linear function concepts. |
|
Data Analysis |
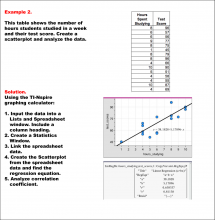
Math Example--Linear Function Concepts--Linear Data Model: Example 2 |
Math Example--Linear Function Concepts--Linear Data Model: Example 2
This is part of a collection of math examples that focus on linear function concepts. |
|
Data Analysis |
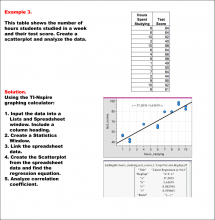
Math Example--Linear Function Concepts--Linear Data Model: Example 3 |
Math Example--Linear Function Concepts--Linear Data Model: Example 3
This is part of a collection of math examples that focus on linear function concepts. |
|
Data Analysis |
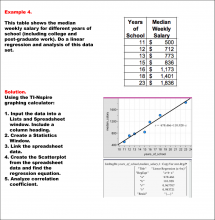
Math Example--Linear Function Concepts--Linear Data Model: Example 4 |
Math Example--Linear Function Concepts--Linear Data Model: Example 4
This is part of a collection of math examples that focus on linear function concepts. |
|
Data Analysis |

