
These are the resources that support this NYS Standard.
NY-1.MD.4: Organize, represent, and interpret data with up to three categories; ask and answer questions about the total number of data points, how many in each category, and how many more or less are in one category than in another.
There are 19 resources.| Description | Thumbnail Image | Curriculum Topics | Description | |
|---|---|---|---|---|
Math Examples Collection: Charts, Graphs, and Plots |
|
Slope-Intercept Form, Data Analysis, Point-Slope Form and Subtraction Facts to 100 | This collection aggregates all the math examples around the topic of Charts, Graphs, and Plots. There are a total of 38 Math Examples. This collection of resources is made up of downloadable PNG images that you can easily incorporate into your lesson plans. | |
Quizlet Flash Card Collection: Counting |
|
Units of Measure, Counting, Addition Facts to 25, Subtraction Facts to 10 and Working with Money | This is a collection of Quizlet Flash Cards on the topic of Counting. There are a total of 5 Quizlet Flash Card sets. | |
Math Clip Art Collection: Statistics |
Overview This colle |
|
Data Analysis, Probability, Data Gathering and Counting | This collection aggregates all the math clip art around the topic of Statistics. There are a total of 55 images. |
Math Examples Collection: Graphs From Categorical Data |
Overview |

|
Data Analysis | This collection aggregates all the math examples around the topic of Graphs of Categorical Data. There are a total of 6 Math Examples. |
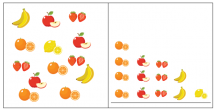
Math Clip Art--Fruit Image 1 |
Math Clip Art--Fruit Image 1This is part of a collection of math clip art images that show a variety of fruit images. |

|
Counting | |
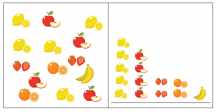
Math Clip Art--Fruit Image 2 |
Math Clip Art--Fruit Image 2This is part of a collection of math clip art images that show a variety of fruit images. |

|
Counting | |
Math Clip Art--Fruit Image 3 |
Math Clip Art--Fruit Image 3This is part of a collection of math clip art images that show a variety of fruit images. |

|
Counting | |
Math Clip Art--Fruit Image 4 |
Math Clip Art--Fruit Image 4This is part of a collection of math clip art images that show a variety of fruit images. |

|
Counting | |
Math Clip Art--Fruit Image 5 |
Math Clip Art--Fruit Image 5This is part of a collection of math clip art images that show a variety of fruit images. |

|
Counting | |
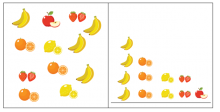
Math Clip Art--Statistics--Fruit Pictograph-1 |
Math Clip Art--Statistics--Fruit Pictograph-1This is part of a collection of math clip art images that show different statistical graphs and concepts, along with some probability concepts. |
|
Counting | |
Math Clip Art--Statistics--Fruit Pictograph-2 |
Math Clip Art--Statistics--Fruit Pictograph-2This is part of a collection of math clip art images that show different statistical graphs and concepts, along with some probability concepts. |
|
Counting | |
Math Clip Art--Statistics--Fruit Pictograph-3 |
Math Clip Art--Statistics--Fruit Pictograph-3This is part of a collection of math clip art images that show different statistical graphs and concepts, along with some probability concepts. |
|
Counting | |
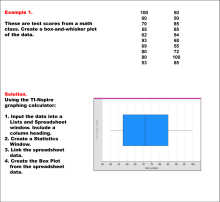
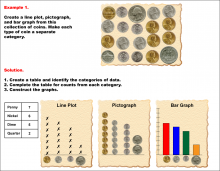
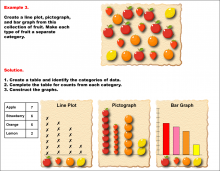
Math Example--Charts, Graphs, and Plots--Graphs of Categorical Data--Example 1 |
Math Example--Charts, Graphs, and Plots-- Graphs of Categorical Data--Example 1In this set of math examples, analyze the behavior of different scatterplots. This includes linear and quadratic models. |
|
Data Analysis | |
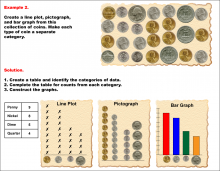
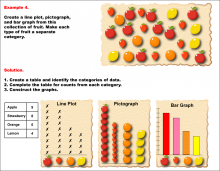
Math Example--Charts, Graphs, and Plots--Graphs of Categorical Data--Example 2 |
Math Example--Charts, Graphs, and Plots-- Graphs of Categorical Data--Example 2In this set of math examples, analyze the behavior of different scatterplots. This includes linear and quadratic models. |
|
Data Analysis | |
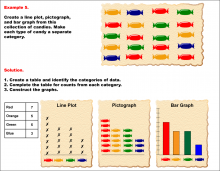
Math Example--Charts, Graphs, and Plots--Graphs of Categorical Data--Example 3 |
Math Example--Charts, Graphs, and Plots-- Graphs of Categorical Data--Example 3In this set of math examples, analyze the behavior of different scatterplots. This includes linear and quadratic models. |
|
Data Analysis | |
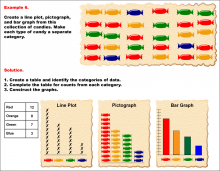
Math Example--Charts, Graphs, and Plots--Graphs of Categorical Data--Example 4 |
Math Example--Charts, Graphs, and Plots-- Graphs of Categorical Data--Example 4In this set of math examples, analyze the behavior of different scatterplots. This includes linear and quadratic models. |
|
Data Analysis | |
Math Example--Charts, Graphs, and Plots--Graphs of Categorical Data--Example 5 |
Math Example--Charts, Graphs, and Plots-- Graphs of Categorical Data--Example 5In this set of math examples, analyze the behavior of different scatterplots. This includes linear and quadratic models. |
|
Data Analysis | |
Math Example--Charts, Graphs, and Plots--Graphs of Categorical Data--Example 6 |
Math Example--Charts, Graphs, and Plots-- Graphs of Categorical Data--Example 6In this set of math examples, analyze the behavior of different scatterplots. This includes linear and quadratic models. |
|
Data Analysis | |
Quizlet Flash Cards: Counting Coins, Set 01 |
DescriptionIn this interactive students are asked to calculate the amount of money based on an array of coins shown. Note: Audio is off by default. To change settings, press the Options button. Note: The download is the teacher's guide for using Media4Math's Quizlet Flash Cards. |
|
Units of Measure and Working with Money |
Join the hundreds of thousands of math educators who have used Media4Math resources in their classroom to engage their students. Our new integrated Library/Classroom product has everything you need!
About Media4Math
Our Mission
Media4Math's mission is to educate 21st-century students in real-world applications of math with digital technology. We bring math to life in your classroom with a rich blend of resources to inspire your students to learn. Our philosophy is that the procedural side of math is a prerequisite to using it, but we also find that real-world math applications can provide motivation and even inspiration for math students. Math is its own language and it has important stories to tell. While many of our resources are for procedural skills, there are many resources that are real-world applications of math. Some of these resources rely on partnerships with other educational publishers.
About Media4Math Library
Media4Math Library contains over 15,000 high-quality resources designed for classroom or home use. This includes instructional, remediation, and assessment resources. You'll find truly innovative resources that bring math to life. Resources in Media4Math Library include:
- Videos
- Math Clip Art
- Math Examples
- Quizzes
- Tutorials
- PowerPoint and Google Slide presentations
- GoogleEarth Voyager Stories
- Algebra Applications
- Geometry Explorations
- Quizlet Flash Cards
- Desmos Resources
- Texas Instrument Resources
- Games and Simulations
About Media4Math Classroom
Media4Math Classroom provides ready-to-use interactive math lessons that teach, assess, and provide real-world applications of topics in Pre-Algebra, Algebra, and Geometry. Assign these modules to your students and capture assessment scores in an easy-to-use Dashboard. This is a growing library of instructional modules. Topics include:
- Arithmetic
- Pre-Algebra
- Algebra
- Geometry
- SAT Math Prep
Media4Math Classroom modules provide real world applications of math that will motivate your students. Here are some examples:
- Construction Site Math. Apply ratios and proportions to mixtures of cement and concrete. This module includes video resources and your students will get a real-world application of ratios and proportions.
- Counting Bison. Apply place value concepts to the real-world application of the bison population. Because the bison population has gone through dramatic changes in population, this become an opportunity to use and apply place value.
- Wildlife Refuge. This study of area and perimeter centers on the mustang population in the Nevada area. Students explore the relationship between area and perimeter of rectangular shapes in the context of designing a wildlife refuge.
The Media4Math Bundle
A subscription to the Media4Math bundle gives teachers access to all the resources listed above. Specifically:
- Access to all the Media4Math Library resources and tools.
- Access to all the Media4Math Classroom instructional modules.
To learn more about our subscription packages, contact us at admin@media4math.com.
Partnering with Media4Math
Media4Math prides itself on its strategic partnerships with other educational organizations. Our partnerships include the following partners:
-
Google Earth. Media4Math has partnered with GoogleEarth to create a comprehensive library of GoogleEarth Voyager Stories. These map-based explorations of geometry, geography, and culture will literally bring the math to life. See our collection of Voyager Stories by clicking on this link to the Google Earth resources.
-
Texas Instruments. TI is the leading provider of graphing calculators used in the classroom. Media4Math has partnered with TI to create a library of digital resources to support the use of these graphing calculators. These resources include videos, presentations, and related tutorials. See our collection of TI resources by clicking on this link to the TI resources.
-
Desmos. This free online resource that includes a graphing calculator and geometry tools. Media4Math has created an extensive library of resources that support the use of these Desmos resources. See our collection of Desmos resources by clicking on this link to the Desmos resources.
- Quizlet. We have partnered with the leading provider of interactive Flash Cards and is used by millions of teachers and students around the world. Media4Math has developed an extensive library of Quizlet resources. See our collection of Quizlet resources by clicking on this link to the Quizlet resources.
Link to the Media4Math Study Sets on Quizlet and search for "Media4Math."
- The Princeton Review. The Princeton Review is the leading provider of SAT prep and other test preparation courses and tutorials. Media4Math is an affiliate of Princeton Review and we have created a set of free SAT math resources, sponsored by Princeton Review. See this collection of SAT resources by clicking on this link to the Princeton Review resources.
If you would like to partner with Media4Math, please reach out to us at admin@media4math.com.