These are the resources that support this Florida Standard.
MAFS.6.SP.1.1: Recognize a statistical question as one that anticipates variability in the data related to the question and accounts for it in the answers. For example, “How old am I?” is not a statistical question, but “How old are the students in my school?” is a statistical question because one anticipates variability in students’ ages.
There are 15 resources.| Title | Description | Thumbnail Image | Curriculum Topics |
|---|---|---|---|
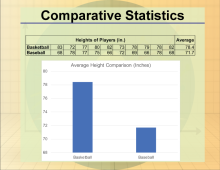
Math Clip Art Collection: Statistics |
Overview This colle |
|
Data Analysis, Probability, Data Gathering and Counting |
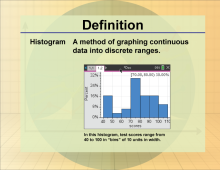
Math Definitions Collection: Statistics and Probability |
|
Data Analysis, Probability and Data Gathering | |
Math in the News Collection: Applications of Data Analysis |

|
Data Analysis, Data Gathering, Probability, Percents and Ratios and Rates | |
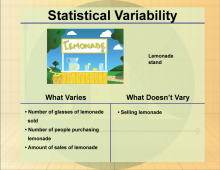
Math Clip Art--Statistics and Probability-- Statistical Variability--10 |
Math Clip Art--Statistics and Probability-- Statistical Variability--10This is part of a collection of math clip art images that show different statistical graphs and concepts, along with some probability concepts. |
|
Data Gathering |
Math Clip Art--Statistics and Probability-- Statistical Variability--5 |
Math Clip Art--Statistics and Probability-- Statistical Variability--5This is part of a collection of math clip art images that show different statistical graphs and concepts, along with some probability concepts. |
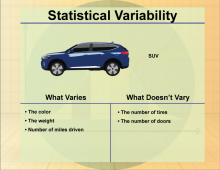
|
Data Gathering |
Math Clip Art--Statistics and Probability-- Statistical Variability--6 |
Math Clip Art--Statistics and Probability-- Statistical Variability--6This is part of a collection of math clip art images that show different statistical graphs and concepts, along with some probability concepts. |
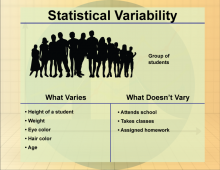
|
Data Gathering |
Math Clip Art--Statistics and Probability-- Statistical Variability--7 |
Math Clip Art--Statistics and Probability-- Statistical Variability--7This is part of a collection of math clip art images that show different statistical graphs and concepts, along with some probability concepts. |
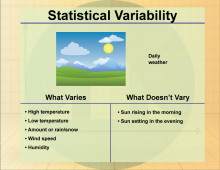
|
Data Gathering |
Math Clip Art--Statistics and Probability-- Statistical Variability--8 |
Math Clip Art--Statistics and Probability-- Statistical Variability--8This is part of a collection of math clip art images that show different statistical graphs and concepts, along with some probability concepts. |
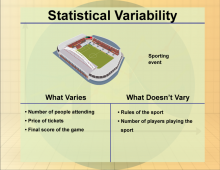
|
Data Gathering |
Math Clip Art--Statistics and Probability-- Statistical Variability--9 |
Math Clip Art--Statistics and Probability-- Statistical Variability--9This is part of a collection of math clip art images that show different statistical graphs and concepts, along with some probability concepts. |
|
Data Gathering |
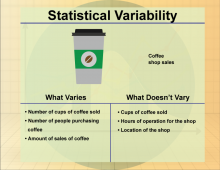
Math Clip Art--Statistics--Statistical Variability--01 |
Math Clip Art--Statistics--Statistical Variability--01This is part of a collection of math clip art images that show different statistical graphs and concepts, along with some probability concepts. |
|
Data Gathering |
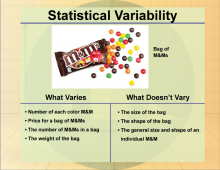
Math Clip Art--Statistics--Statistical Variability--02 |
Math Clip Art--Statistics--Statistical Variability--02This is part of a collection of math clip art images that show different statistical graphs and concepts, along with some probability concepts. |
|
Data Gathering |
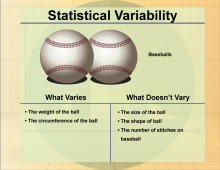
Math Clip Art--Statistics--Statistical Variability--03 |
Math Clip Art--Statistics--Statistical Variability--03This is part of a collection of math clip art images that show different statistical graphs and concepts, along with some probability concepts. |
|
Data Gathering |
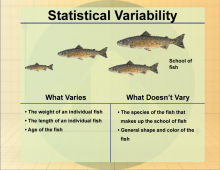
Math Clip Art--Statistics--Statistical Variability--04 |
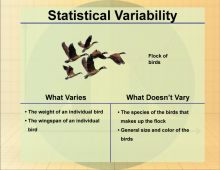
Math Clip Art--Statistics--Statistical Variability--04This is part of a collection of math clip art images that show different statistical graphs and concepts, along with some probability concepts. |
|
Data Gathering |
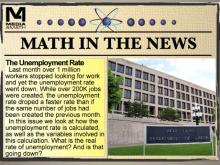
Math in the News: Issue 46--The Unemployment Rate |
Math in the News: Issue 46--The Unemployment RateFebruary 2012. In this issue we look at unemployment statistics from the Bureau of Labor Statistics. |
|
Data Analysis |
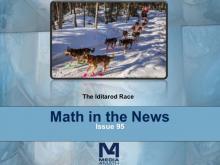
Math in the News: Issue 95--The Iditarod Race |
Math in the News: Issue 95--The Iditarod RaceMarch 2014. In this issue of Math in the News we look at the Iditarod Race in Alaska. This gives us an opportunity to analyze data on average speed. We look at data in tables and line graphs and analyze the winning speeds over the history of the race. |
|
Data Analysis |

