These are the resources that support this Florida Standard.
MA.912.DP.5.11 - Evaluate reports based on data from diverse media, print and digital resources by interpreting graphs and tables; evaluating data-based arguments; determining whether a valid sampling method was used; or interpreting provided statistics.
Displaying 51 - 100 of 101 resources:
| Thumbnail Image | Title | Description | Curriculum Nodes |
|---|---|---|---|
|
Definition--Statistics and Probability Concepts--Population |
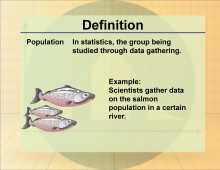
Definition--Statistics and Probability Concepts--Population
This is part of a collection of definitions on the topic of probability and statistics. Each definition includes an example of the term. |
Data Gathering |
|
Definition--Statistics and Probability Concepts--Probability |
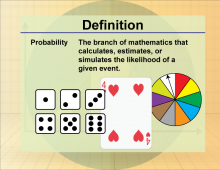
Definition--Statistics and Probability Concepts--Probability
This is part of a collection of definitions on the topic of probability and statistics. Each definition includes an example of the term. |
Probability |
|
Definition--Statistics and Probability Concepts--Probability Model |
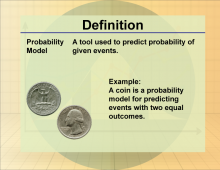
Definition--Statistics and Probability Concepts--Probability Model
This is part of a collection of definitions on the topic of probability and statistics. Each definition includes an example of the term. |
Probability |
|
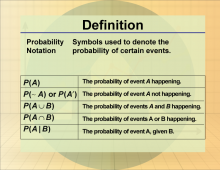
Definition--Statistics and Probability Concepts--Probability Notation |
Definition--Statistics and Probability Concepts--Probability Notation
This is part of a collection of definitions on the topic of probability and statistics. |
Data Analysis |
|
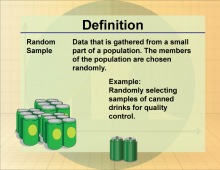
Definition--Statistics and Probability Concepts--Random Sample |
Definition--Statistics and Probability Concepts--Random Sample
This is part of a collection of definitions on the topic of probability and statistics. Each definition includes an example of the term. |
Data Gathering |
|
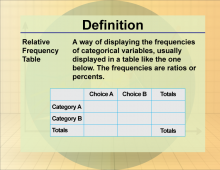
Definition--Statistics and Probability Concepts--Relative Frequency Table |
Definition--Statistics and Probability Concepts--Relative Frequency Table
This is part of a collection of definitions on the topic of probability and statistics. |
Data Analysis |
|
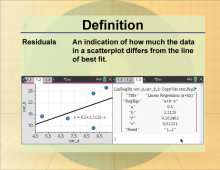
Definition--Statistics and Probability Concepts--Residuals |
Definition--Statistics and Probability Concepts--Residuals
This is part of a collection of definitions on the topic of probability and statistics. Each definition includes an example of the term. |
Data Analysis |
|
Definition--Statistics and Probability Concepts--Sample Space |
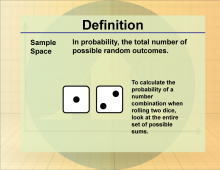
Definition--Statistics and Probability Concepts--Sample Space
This is part of a collection of definitions on the topic of probability and statistics. Each definition includes an example of the term. |
Probability |
|
Definition--Statistics and Probability Concepts--Scatterplot |
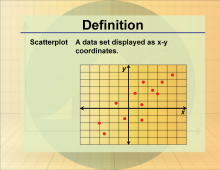
Definition--Statistics and Probability Concepts--Scatterplot
This is part of a collection of definitions on the topic of probability and statistics. Each definition includes an example of the term. |
Data Analysis |
|
Definition--Statistics and Probability Concepts--Statistic |
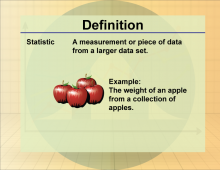
Definition--Statistics and Probability Concepts--Statistic
This is part of a collection of definitions on the topic of probability and statistics. Each definition includes an example of the term. |
Data Gathering |
|
Definition--Statistics and Probability Concepts--Statistical Distribution |
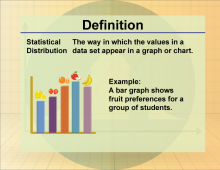
Definition--Statistics and Probability Concepts--Statistical Distribution
This is part of a collection of definitions on the topic of probability and statistics. |
Data Gathering |
|
Definition--Statistics and Probability Concepts--Statistical Variability |
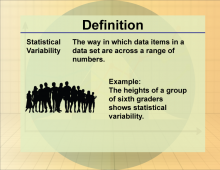
Definition--Statistics and Probability Concepts--Statistical Variability
This is part of a collection of definitions on the topic of probability and statistics. |
Data Gathering |
|
Definition--Statistics and Probability Concepts--Stem-and-Leaf Plot |
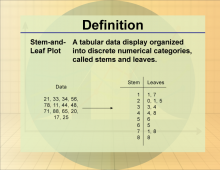
Definition--Statistics and Probability Concepts--Stem-and-Leaf Plot
This is part of a collection of definitions on the topic of probability and statistics. Each definition includes an example of the term. |
Data Analysis |
|
Definition--Statistics and Probability Concepts--Two-Way Frequency Table |
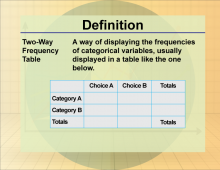
Definition--Statistics and Probability Concepts--Two-Way Frequency Table
This is part of a collection of definitions on the topic of probability and statistics. |
Data Analysis |
|
Formulas--Combinations |
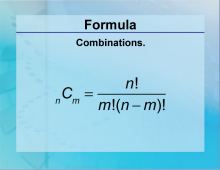
Formulas--Combinations
The formula for calculating a combination of n items taken m at a time. |
Combinatorics |
|
Instructional Resource: Tutorial: Probability and Playing Cards, Lesson 1 |
Instructional Resource: Tutorial: Probability and Playing Cards, Lesson 1
In this tutorial, learn about the probability of drawing a specific card from a deck of 52 cards. |
Probability |

|
Instructional Resource: Tutorial: Probability and Playing Cards, Lesson 2 |
Instructional Resource: Tutorial: Probability and Playing Cards, Lesson 2
In this tutorial, learn about the probability of drawing a specific card from a deck of 52 cards. |
Probability |

|
Instructional Resource: Tutorial: Probability and Playing Cards, Lesson 3: Pocket Aces |
Instructional Resource: Tutorial: Probability and Playing Cards, Lesson 3
In this tutorial, learn about the probability of drawing two aces consecutively from a deck of 52 cards. |
Probability |
|
Instructional Resource: Tutorial: Probability and Playing Cards, Lesson 4: Playing Poker |
Instructional Resource: Tutorial: Probability and Playing Cards, Lesson 4
In this tutorial, learn about the permutations and combinations involved in calculating card arrangements. |
Probability |

|
Instructional Resource: Tutorial: Probability and Playing Cards, Lesson 5: Playing Poker |
Instructional Resource: Tutorial: Probability and Playing Cards, Lesson 5
In this tutorial, learn about the permutations and combinations involved in calculating card arrangements. |
Probability and Combinatorics |

|
Math Clip Art--Statistics and Probability--Basic Line Plot |
Math Clip Art--Statistics and Probability--Basic Line Plot
This is part of a collection of math clip art images that show different statistical graphs and concepts, along with some probability concepts. |
Length |
|
Math Clip Art--Statistics and Probability--Circle Graph |
Math Clip Art--Statistics and Probability--Circle Graph
This is part of a collection of math clip art images that show different statistical graphs and concepts, along with some probability concepts. |
Data Analysis |
|
Math Clip Art--Statistics--Bar Graph |
Math Clip Art--Statistics--Bar Graph
This is part of a collection of math clip art images that show different statistical graphs and concepts, along with some probability concepts. |
Data Analysis |
|
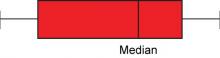
Math Clip Art--Statistics--Box and Whisker Plot |
Math Clip Art--Statistics--Box and Whisker Plot
This is part of a collection of math clip art images that show different statistical graphs and concepts, along with some probability concepts. |
Data Analysis |
|
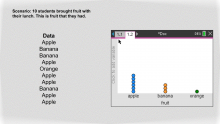
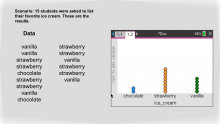
Math Clip Art--Statistics--Line Plots with Data--01 |
Math Clip Art--Statistics--Line Plots with Data--01
This is part of a collection of math clip art images that show different statistical graphs and concepts, along with some probability concepts. |
Data Analysis |
|
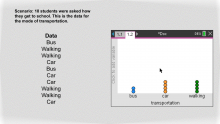
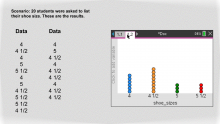
Math Clip Art--Statistics--Line Plots with Data--02 |
Math Clip Art--Statistics--Line Plots with Data--02
This is part of a collection of math clip art images that show different statistical graphs and concepts, along with some probability concepts. |
Data Analysis |
|
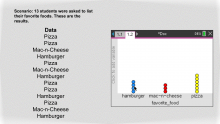
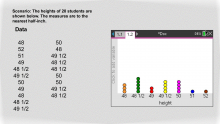
Math Clip Art--Statistics--Line Plots with Data--03 |
Math Clip Art--Statistics--Line Plots with Data--03
This is part of a collection of math clip art images that show different statistical graphs and concepts, along with some probability concepts. |
Data Analysis |
|
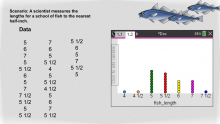
Math Clip Art--Statistics--Line Plots with Data--04 |
Math Clip Art--Statistics--Line Plots with Data--04
This is part of a collection of math clip art images that show different statistical graphs and concepts, along with some probability concepts. |
Data Analysis |
|
Math Clip Art--Statistics--Line Plots with Data--05 |
Math Clip Art--Statistics--Line Plots with Data--05
This is part of a collection of math clip art images that show different statistical graphs and concepts, along with some probability concepts. |
Data Analysis |
|
Math Clip Art--Statistics--Line Plots with Data--06 |
Math Clip Art--Statistics--Line Plots with Data--06
This is part of a collection of math clip art images that show different statistical graphs and concepts, along with some probability concepts. |
Data Analysis |
|
Math Clip Art--Statistics--Line Plots with Data--07 |
Math Clip Art--Statistics--Line Plots with Data--07
This is part of a collection of math clip art images that show different statistical graphs and concepts, along with some probability concepts. |
Data Analysis |
|
Math Clip Art--Statistics--Line Plots with Data--08 |
Math Clip Art--Statistics--Line Plots with Data--08
This is part of a collection of math clip art images that show different statistical graphs and concepts, along with some probability concepts. |
Data Analysis |
|
Math Clip Art--Statistics--Line Plots with Data--09 |
Math Clip Art--Statistics--Line Plots with Data--09
This is part of a collection of math clip art images that show different statistical graphs and concepts, along with some probability concepts. |
Data Analysis |
|
Math Clip Art--Statistics--Line Plots with Data--10 |
Math Clip Art--Statistics--Line Plots with Data--10
This is part of a collection of math clip art images that show different statistical graphs and concepts, along with some probability concepts. |
Data Analysis |

|
Math in the News: Issue 100--Late Night TV Ratings |
Math in the News: Issue 100--Late Night TV Ratings
July 2014. In this issue of Math in the News we look at the mathematics of the Nielsen Ratings. |
Data Analysis |

|
Math in the News: Issue 103--Gas Prices |
Math in the News: Issue 103--Gas Prices: Why Are They Decreasing?
December 2014. |
Data Analysis |
|
Math in the News: Issue 105--Movie Statistics: 2014 |
Math in the News: Issue 105--Movie Statistics: 2014
January 2015. In this issue of Math in the News we review box office statistics for the previous year. |
Data Analysis |
|
Math in the News: Issue 106--A Box Office Monster! |
Math in the News: Issue 106--A Box Office Monster!
July 2015. In this issue of Math in the News we analyze the amazing box office success of the recently released Jurassic World. |
Applications of Linear Functions, Standard Form and Data Analysis |

|
Math in the News: Issue 11--Taxing Tobacco |
Math in the News: Issue 11--Taxing Tobacco
5/30/11. In this issue we look at the subject of taxation of tobacco products. Many states are using such taxes to meet budget shortfalls. |
Data Analysis |

|
Math in the News: Issue 117--Box Office Hits and Misses |
Math in the News: Issue 117 | Box Office Hits and Misses
December 2022. In this issue of Math in the News we look at box office hits and misses from Disney. |
Data Analysis |

|
Math in the News: Issue 121--NFL Concussion Statistics |
Math in the News: Issue 121 | NFL Concussion Statistics
February 2023. In this issue of Math in the News we look at NFL statistics for the number of concussions. |
Applications of Ratios, Proportions, and Percents |

|
Math in the News: Issue 16--Blockbuster Math |
Math in the News: Issue 16--Blockbuster Math
7/4/11. In this issue we look at box office receipts for blockbuster movies as well as flops. |
Data Analysis |

|
Math in the News: Issue 19--Mr. 3000 |
Math in the News: Issue 19--Mr. 3000
7/25/11. In this issue we look at the elite group of baseball players that have hit 3000 or more hits in their careers. |
Data Analysis |

|
Math in the News: Issue 3--The 2008 Mortgage Crisis |
Math in the News: Issue 3--The 2008 Mortgage Crisis
March 2011. In this issue we look at the continuing housing crisis that began in 2008. We use a spreadsheet to calculate mortgage payments. |
Applications of Exponential and Logarithmic Functions |

|
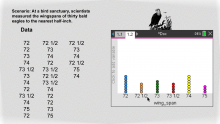
Video Transcript: TI-Nspire Mini-Tutorial: Creating a Histogram |
Video Transcript: TI-Nspire Mini-Tutorial: Creating a Histogram
This is the transcript for the TI-Nspire Mini-Tutorial entitled, Creating a Histogram. |
Data Analysis |
|
|
Video Transcript: TI-Nspire Mini-Tutorial: Creating a Random Number Table |
Video Transcript: TI-Nspire Mini-Tutorial: Creating a Random Number Table
This is the transcript for the TI-Nspire Mini-Tutorial entitled, Creating a Random Number Table. |
Probability |
|
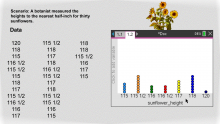
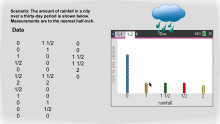
Worksheet: TI-Nspire Mini-Tutorial: Creating a Histogram |
Worksheet: TI-Nspire Mini-Tutorial: Creating a Histogram
This is part of a collection of math worksheets on the use of the TI-Nspire graphing calculator. |
Data Analysis |
|
|
Worksheet: TI-Nspire Mini-Tutorial: Creating a Random Number Table |
Worksheet: TI-Nspire Mini-Tutorial: Creating a Random Number Table
This is part of a collection of math worksheets on the use of the TI-Nspire graphing calculator. |
Probability |
|
|
Worksheet: TI-Nspire Mini-Tutorial: Graphing a Box-and-Whisker Plot |
Worksheet: TI-Nspire Mini-Tutorial: Graphing a Box-and-Whisker Plot
This is part of a collection of math worksheets on the use of the TI-Nspire graphing calculator. |
Data Analysis |
|
|
Worksheet: TI-Nspire Mini-Tutorial: Graphing a Scatterplot Using a Graphs and Geometry Window |
Worksheet: TI-Nspire Mini-Tutorial: Graphing a Scatterplot Using a Graphs and Geometry Window
This is part of a collection of math worksheets on the use of the TI-Nspire graphing calculator. |
Data Analysis |