Digital Resources on the Topic of Probability & Statistics
|
|
| Thumbnail Image | Description | |
|---|---|---|
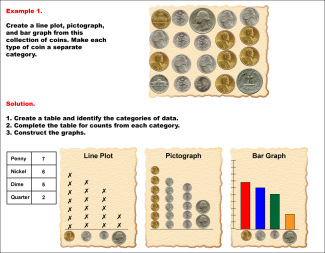
Math Examples Collection: Graphs From Categorical Data |
|
OverviewThis collection aggregates all the math examples around the topic of Graphs of Categorical Data. There are a total of 6 Math Examples. |
Math Video Collection: Algebra Applications Video Series: Data Analysis |
|
OvervThis collection aggregates all the math videos and resources in this series: Algebra Applications Video Series: Data Analysis. There are a total of 26 resources. |
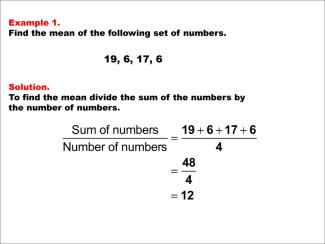
Math Examples Collection: The Mean |
|
OverviewThis collection aggregates all the math examples around the topic of the Mean. There are a total of 42 Math Examples. |
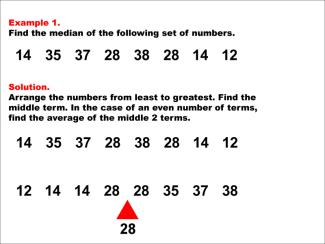
Math Examples Collection: The Median |
|
Overview This collection aggregates all the math examples around the topic of the Median. There are a total of 40 Math Examples. |
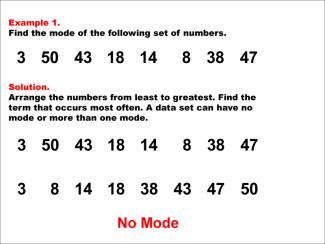
Math Examples Collection: The Mode |
|
Overview This collection aggregates all the math examples around the topic of the Mode. There are a total of 78 Math Examples. |
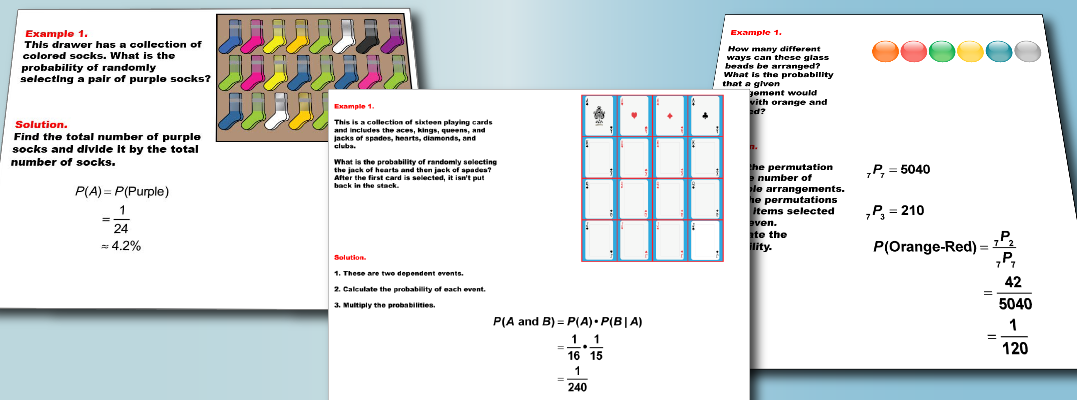
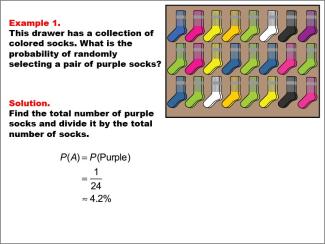
Math Examples Collection: Probability |
|
Overview This collection aggregates all the math examples around the topic of Probability. There are a total of 28 Math Examples. |
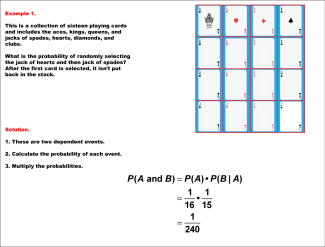
Math Examples Collection: Probability of Conditional Events |
|
This collection aggregates all the math examples around the topic of the Probability of Conditional Events. There are a total of 6 Math Examples. |
Math Examples Collection: Probability with Permutations and Combinations |
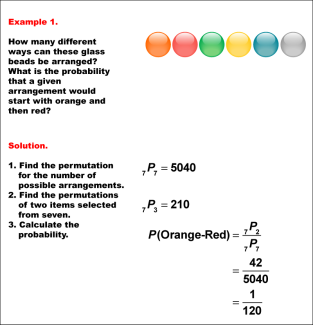
|
This collection aggregates all the math examples around the topic of Probabilities Involving Permutations and Combinations. There are a total of 6 Math Examples. |
Math Worksheet Collection: Data Analysis |
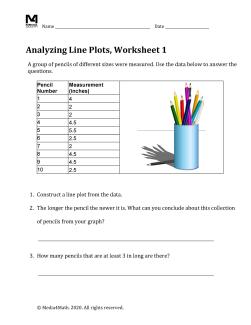
|
This collection aggregates all the math worksheets around the topic of Data Analysis. There are a total of 9 worksheets. |
Math Clip Art Collection: Two-Way Frequency Tables |
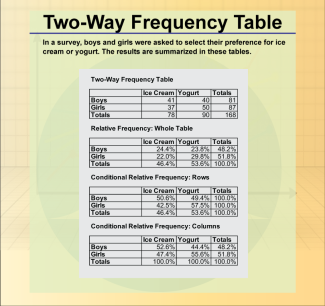
|
This collection aggregates all the math clip art around the topic of Two-Way Frequency Tables. There are a total of 6 images. |
Math Clip Art Collection: Statistics |
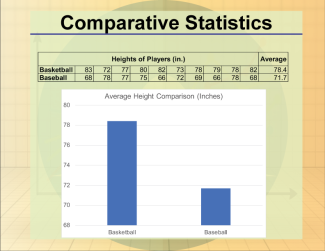
|
Overview This colleThis collection aggregates all the math clip art around the topic of Statistics. There are a total of 55 images. |
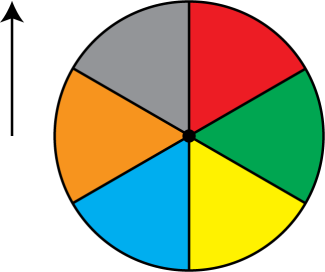
Math Clip Art Collection: Spinners |
|
OverviThis collection aggregates all the math clip art around the topic of Spinners. There are a total of 64 images. |
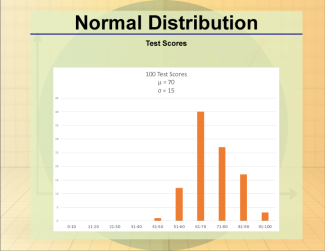
Math Clip Art Collection: Probability Distributions |
|
This collection aggregates all the math clip art around the topic of Probability Distributions. There are a total of 12 images. |
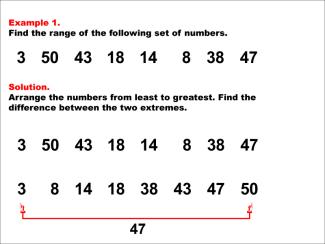
Math Examples Collection: Range |
|
Overview This collection aggregates all the math examples around the topic of Range. There are a total of 26 Math Examples. |
Math Clip Art Collection: Dice and Number Models |

|
This collection aggregates all the math clip art around the topic of Dice and Number Models. There are a total of 28 images. |
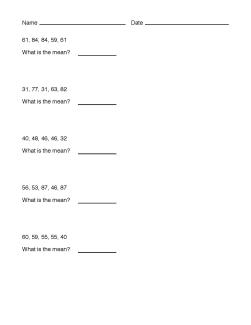
Math Worksheet Collection: Data Analysis: Mean, Median, and Mode |
|
Math Worksheet Collection: Data Analysis: Mean, Median, and Mode This collection aggregates all the math worksheets around the topic of Data Analysis: Mean, Median, and Mode. There are a total of 60 worksheets. |
Math Clip Art Collection: Playing Cards |

|
This collection aggregates all the math clip art around the topic of Playing Cards. There are a total of 52 images. |
VIDEO: Algebra Applications: Data Analysis |

|
VIDEO: Algebra Applications: Data Analysis
In this episode of Algebra Applications, students explore the dramatic events of 2008 related to the mortgage crisis. Brought about principally through mortgage defaults, the effect on the overall economy was severe. |
VIDEO: Algebra Nspirations: Data Analysis and Probability |
|
VIDEO: Algebra Nspirations: Data Analysis and Probability
What are the two meanings of statistics? What does it really mean that an event has a 50% probability of occurring? Why are data analysis and probability always taught together? Written and hosted by internationally acclaimed math educator Dr. |
Closed Captioned Video: Box-and-Whisker Plot |
|
Closed Captioned Video: Box-and-Whisker Plot
In this TI Nspire tutorial the Spreadsheet and Statistics windows are used to create a box-and-whisker plot. This video supports the TI-Nspire Clickpad and Touchpad. This Mini-Tutorial Video includes a worksheet. . |
Closed Captioned Video: Multiseries Scatterplot |
|
Closed Captioned Video: Multiseries Scatterplot
In this TI Nspire tutorial, Spreadsheet and Graph windows are used to graph a multiseries scatterplot. This video supports the TI-Nspire Clickpad and Touchpad. This Mini-Tutorial Video includes a worksheet. |
Closed Captioned Video: Scatterplot 1 |
|
Closed Captioned Video: Scatterplot 1
In this TI Nspire tutorial, Spreadsheet and Graph windows are used to graph a scatterplot. This video supports the TI-Nspire Clickpad and Touchpad. This Mini-Tutorial Video includes a worksheet. |
Closed Captioned Video: Scatterplot 2 |
|
Closed Captioned Video: Scatterplot 2
In this TI Nspire tutorial, Spreadsheet and Statistics windows are used to graph a scatterplot. This video supports the TI-Nspire Clickpad and Touchpad. This Mini-Tutorial Video includes a worksheet. |
Closed Captioned Video: A Probability Simulation 2 |
|
Closed Captioned Video: A Probability Simulation 2
In this TI Nspire tutorial, the Spreadsheet and Statistics windows are used to create a probability simulation of a coin toss. This video supports the TI-Nspire Clickpad and Touchpad. This Mini-Tutorial Video includes a worksheet. . |
Closed Captioned Video: A Probability Simulation 3 |
|
Closed Captioned Video: A Probability Simulation 3
In this TI Nspire tutorial, the Spreadsheet and Statistics windows are used to create a probability simulation of tossing two coins. This video supports the TI-Nspire Clickpad and Touchpad. This Mini-Tutorial Video includes a worksheet. . |