Content Showcase: Math Examples
Media4Math has a huge collection of instructional math examples covering a wide range of math topics. This collection of resources includes images that you can easily incorporate into your lesson plans. To see these examples organized into topical collections, click on this link.
| Thumbnail Image | Description | Description | Curriculum Nodes | |
|---|---|---|---|---|
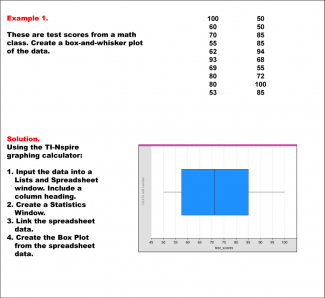
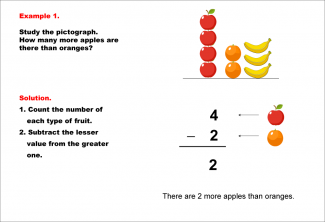
Math Example--Charts, Graphs, and Plots--Data Plot--Example 1 |
|
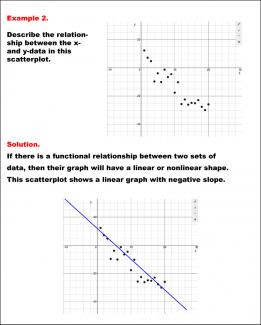
Math Example--Charts, Graphs, and Plots-- Data Plot--Example 1In this set of math examples, analyze the behavior of different scatterplots. This includes linear and quadratic models. |
Data Analysis | |
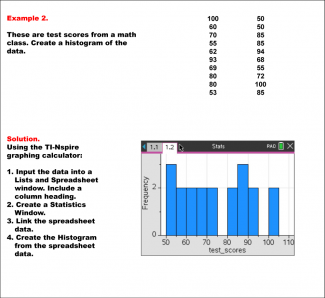
Math Example--Charts, Graphs, and Plots--Data Plot--Example 2 |
|
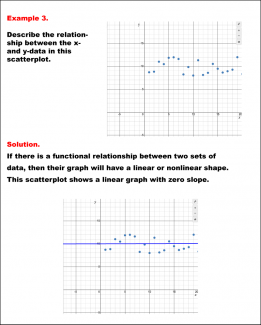
Math Example--Charts, Graphs, and Plots-- Data Plot--Example 2In this set of math examples, analyze the behavior of different scatterplots. This includes linear and quadratic models. |
Data Analysis | |
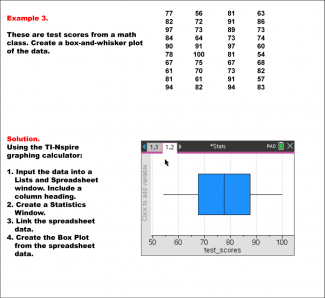
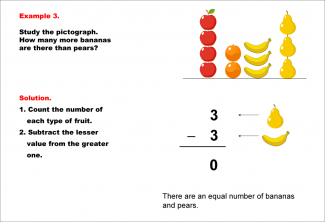
Math Example--Charts, Graphs, and Plots--Data Plot--Example 3 |
|
Math Example--Charts, Graphs, and Plots-- Data Plot--Example 3In this set of math examples, analyze the behavior of different scatterplots. This includes linear and quadratic models. |
Data Analysis | |
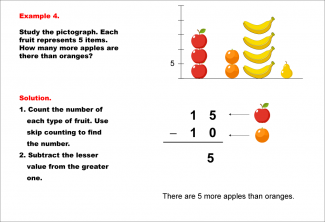
Math Example--Charts, Graphs, and Plots--Data Plot--Example 4 |
|
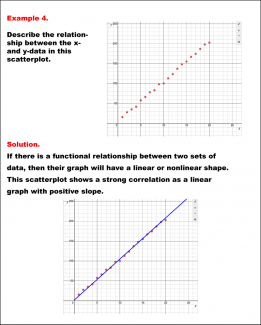
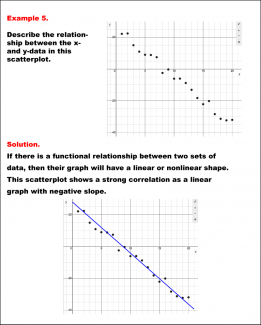
Math Example--Charts, Graphs, and Plots-- Data Plot--Example 4In this set of math examples, analyze the behavior of different scatterplots. This includes linear and quadratic models. |
Data Analysis | |
Math Example--Charts, Graphs, and Plots--Graphs of Categorical Data--Example 1 |
|
Math Example--Charts, Graphs, and Plots-- Graphs of Categorical Data--Example 1In this set of math examples, analyze the behavior of different scatterplots. This includes linear and quadratic models. |
Data Analysis | |
Math Example--Charts, Graphs, and Plots--Graphs of Categorical Data--Example 2 |
|
Math Example--Charts, Graphs, and Plots-- Graphs of Categorical Data--Example 2In this set of math examples, analyze the behavior of different scatterplots. This includes linear and quadratic models. |
Data Analysis | |
Math Example--Charts, Graphs, and Plots--Graphs of Categorical Data--Example 3 |
|
Math Example--Charts, Graphs, and Plots-- Graphs of Categorical Data--Example 3In this set of math examples, analyze the behavior of different scatterplots. This includes linear and quadratic models. |
Data Analysis | |
Math Example--Charts, Graphs, and Plots--Graphs of Categorical Data--Example 4 |
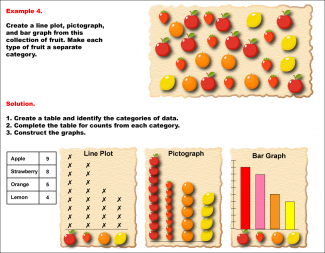
|
Math Example--Charts, Graphs, and Plots-- Graphs of Categorical Data--Example 4In this set of math examples, analyze the behavior of different scatterplots. This includes linear and quadratic models. |
Data Analysis | |
Math Example--Charts, Graphs, and Plots--Graphs of Categorical Data--Example 5 |
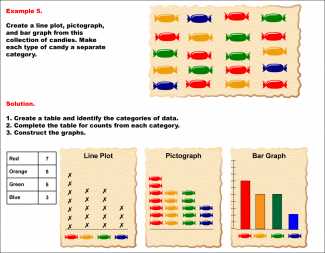
|
Math Example--Charts, Graphs, and Plots-- Graphs of Categorical Data--Example 5In this set of math examples, analyze the behavior of different scatterplots. This includes linear and quadratic models. |
Data Analysis | |
Math Example--Charts, Graphs, and Plots--Graphs of Categorical Data--Example 6 |
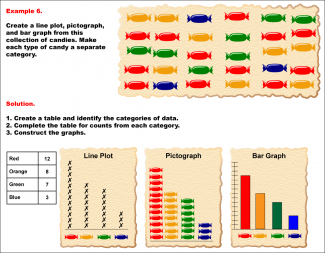
|
Math Example--Charts, Graphs, and Plots-- Graphs of Categorical Data--Example 6In this set of math examples, analyze the behavior of different scatterplots. This includes linear and quadratic models. |
Data Analysis | |
Math Example--Charts, Graphs, and Plots--Analyzing Scatterplots: Example 1 |
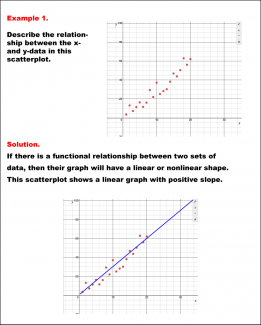
|
Math Example--Charts, Graphs, and Plots-- Analyzing Scatterplots: Example 1In this set of math examples, analyze the behavior of different scatterplots. This includes linear and quadratic models. |
Data Analysis | |
Math Example--Charts, Graphs, and Plots--Analyzing Scatterplots: Example 2 |
|
Math Example--Charts, Graphs, and Plots-- Analyzing Scatterplots: Example 2In this set of math examples, analyze the behavior of different scatterplots. This includes linear and quadratic models. |
Data Analysis | |
Math Example--Charts, Graphs, and Plots--Analyzing Scatterplots: Example 3 |
|
Math Example--Charts, Graphs, and Plots-- Analyzing Scatterplots: Example 3In this set of math examples, analyze the behavior of different scatterplots. This includes linear and quadratic models. |
Data Analysis | |
Math Example--Charts, Graphs, and Plots--Analyzing Scatterplots: Example 4 |
|
Math Example--Charts, Graphs, and Plots-- Analyzing Scatterplots: Example 4In this set of math examples, analyze the behavior of different scatterplots. This includes linear and quadratic models. |
Data Analysis | |
Math Example--Charts, Graphs, and Plots--Analyzing Scatterplots: Example 5 |
|
Math Example--Charts, Graphs, and Plots-- Analyzing Scatterplots: Example 5In this set of math examples, analyze the behavior of different scatterplots. This includes linear and quadratic models. |
Data Analysis | |
Math Example--Charts, Graphs, and Plots--Analyzing Scatterplots: Example 6 |
|
Math Example--Charts, Graphs, and Plots-- Analyzing Scatterplots: Example 6In this set of math examples, analyze the behavior of different scatterplots. This includes linear and quadratic models. |
Data Analysis | |
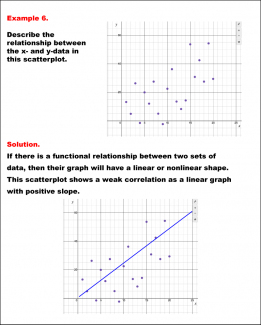
Math Example--Charts, Graphs, and Plots--Analyzing Scatterplots: Example 7 |
|
Math Example--Charts, Graphs, and Plots-- Analyzing Scatterplots: Example 7In this set of math examples, analyze the behavior of different scatterplots. This includes linear and quadratic models. |
Data Analysis | |
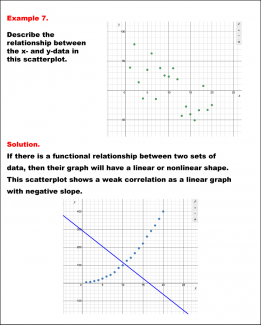
Math Example--Charts, Graphs, and Plots--Analyzing Scatterplots: Example 8 |
|
Math Example--Charts, Graphs, and Plots-- Analyzing Scatterplots: Example 8In this set of math examples, analyze the behavior of different scatterplots. This includes linear and quadratic models. |
Data Analysis | |
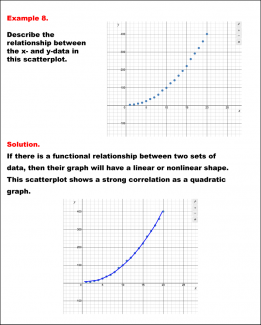
Math Example--Charts, Graphs, and Plots--Analyzing Scatterplots: Example 9 |
|
Math Example--Charts, Graphs, and Plots-- Analyzing Scatterplots: Example 9In this set of math examples, analyze the behavior of different scatterplots. This includes linear and quadratic models. |
Data Analysis | |
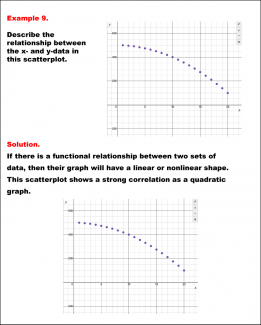
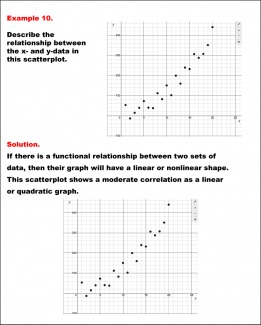
Math Example--Charts, Graphs, and Plots--Analyzing Scatterplots: Example 10 |
|
Math Example--Charts, Graphs, and Plots-- Analyzing Scatterplots: Example 10In this set of math examples, analyze the behavior of different scatterplots. This includes linear and quadratic models. |
Data Analysis | |
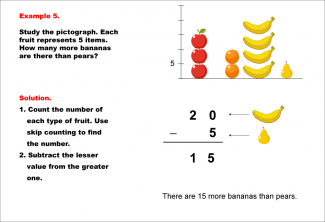
Math Example--Charts, Graphs, and Plots--Reading and Interpreting Scaled Graphs--Example 1 |
|
Math Example--Charts, Graphs, and Plots-- Reading and Interpreting Scaled Graphs--Example 1In this set of math examples, analyze the behavior of different scatterplots. This includes linear and quadratic models. |
Subtraction Facts to 100 and Data Analysis | |
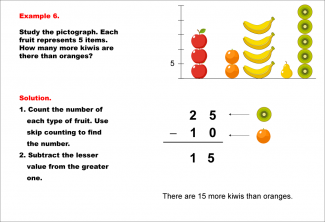
Math Example--Charts, Graphs, and Plots--Reading and Interpreting Scaled Graphs--Example 2 |

|
Math Example--Charts, Graphs, and Plots-- Reading and Interpreting Scaled Graphs--Example 2In this set of math examples, analyze the behavior of different scatterplots. This includes linear and quadratic models. |
Subtraction Facts to 100 and Data Analysis | |
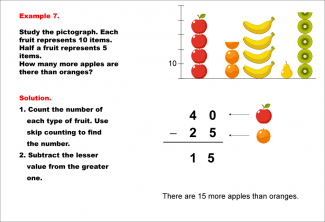
Math Example--Charts, Graphs, and Plots--Reading and Interpreting Scaled Graphs--Example 3 |
|
Math Example--Charts, Graphs, and Plots-- Reading and Interpreting Scaled Graphs--Example 3In this set of math examples, analyze the behavior of different scatterplots. This includes linear and quadratic models. |
Subtraction Facts to 100 and Data Analysis | |
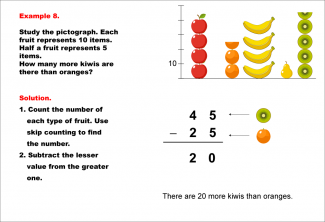
Math Example--Charts, Graphs, and Plots--Reading and Interpreting Scaled Graphs--Example 4 |
|
Math Example--Charts, Graphs, and Plots-- Reading and Interpreting Scaled Graphs--Example 4In this set of math examples, analyze the behavior of different scatterplots. This includes linear and quadratic models. |
Subtraction Facts to 100 and Data Analysis | |
Math Example--Charts, Graphs, and Plots--Reading and Interpreting Scaled Graphs--Example 5 |
|
Math Example--Charts, Graphs, and Plots-- Reading and Interpreting Scaled Graphs--Example 5In this set of math examples, analyze the behavior of different scatterplots. This includes linear and quadratic models. |
Subtraction Facts to 100 and Data Analysis | |
Math Example--Charts, Graphs, and Plots--Reading and Interpreting Scaled Graphs--Example 6 |
|
Math Example--Charts, Graphs, and Plots-- Reading and Interpreting Scaled Graphs--Example 6In this set of math examples, analyze the behavior of different scatterplots. This includes linear and quadratic models. |
Subtraction Facts to 100 and Data Analysis | |
Math Example--Charts, Graphs, and Plots--Reading and Interpreting Scaled Graphs--Example 7 |
|
Math Example--Charts, Graphs, and Plots-- Reading and Interpreting Scaled Graphs--Example 7In this set of math examples, analyze the behavior of different scatterplots. This includes linear and quadratic models. |
Subtraction Facts to 100 and Data Analysis | |
Math Example--Charts, Graphs, and Plots--Reading and Interpreting Scaled Graphs--Example 8 |
|
Math Example--Charts, Graphs, and Plots-- Reading and Interpreting Scaled Graphs--Example 8In this set of math examples, analyze the behavior of different scatterplots. This includes linear and quadratic models. |
Subtraction Facts to 100 and Data Analysis | |
Math Example--Charts, Graphs, and Plots--Reading and Interpreting Scaled Graphs--Example 9 |
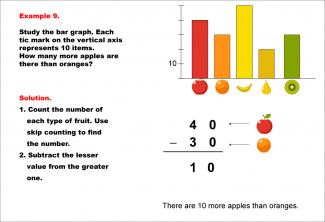
|
Math Example--Charts, Graphs, and Plots-- Reading and Interpreting Scaled Graphs--Example 9In this set of math examples, analyze the behavior of different scatterplots. This includes linear and quadratic models. |
Subtraction Facts to 100 and Data Analysis | |
Math Example--Charts, Graphs, and Plots--Reading and Interpreting Scaled Graphs--Example 10 |
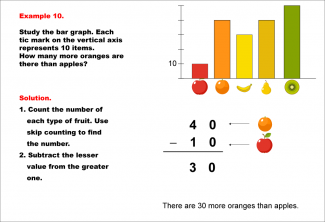
|
Math Example--Charts, Graphs, and Plots-- Reading and Interpreting Scaled Graphs--Example 10In this set of math examples, analyze the behavior of different scatterplots. This includes linear and quadratic models. |
Subtraction Facts to 100 and Data Analysis |