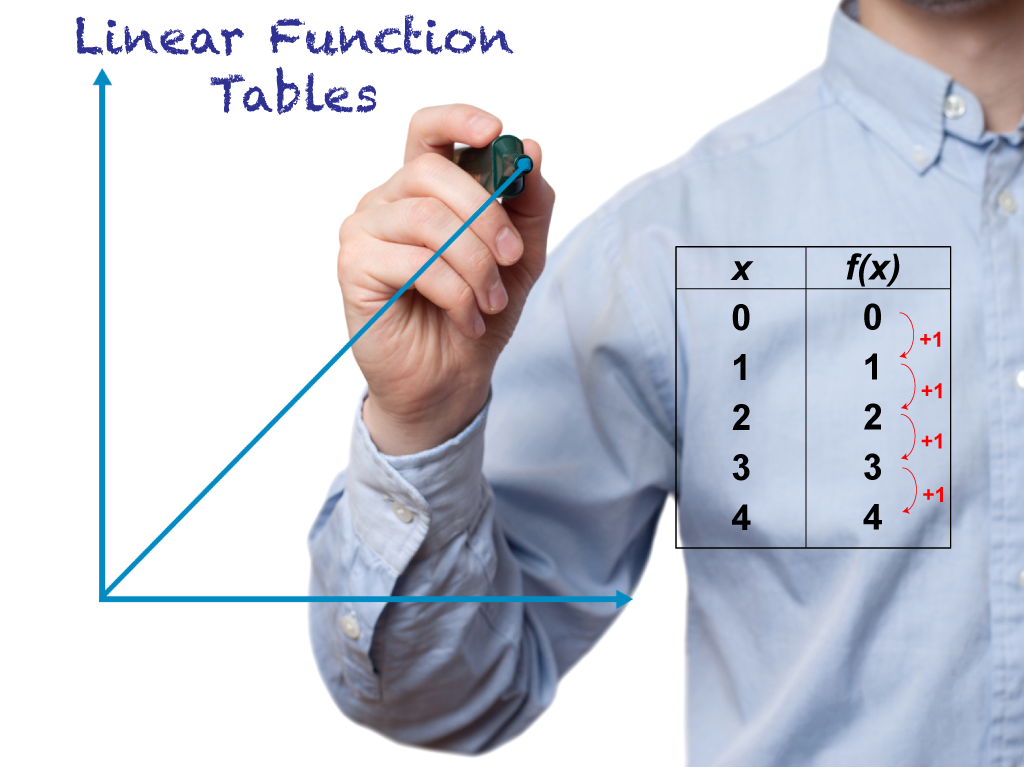
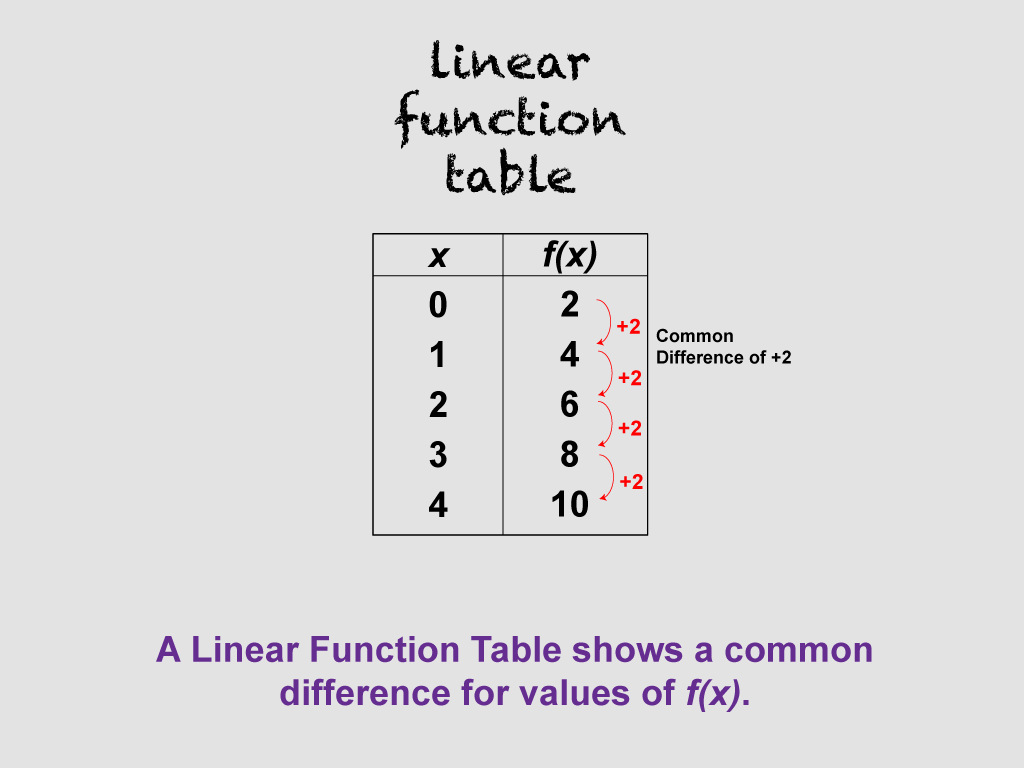
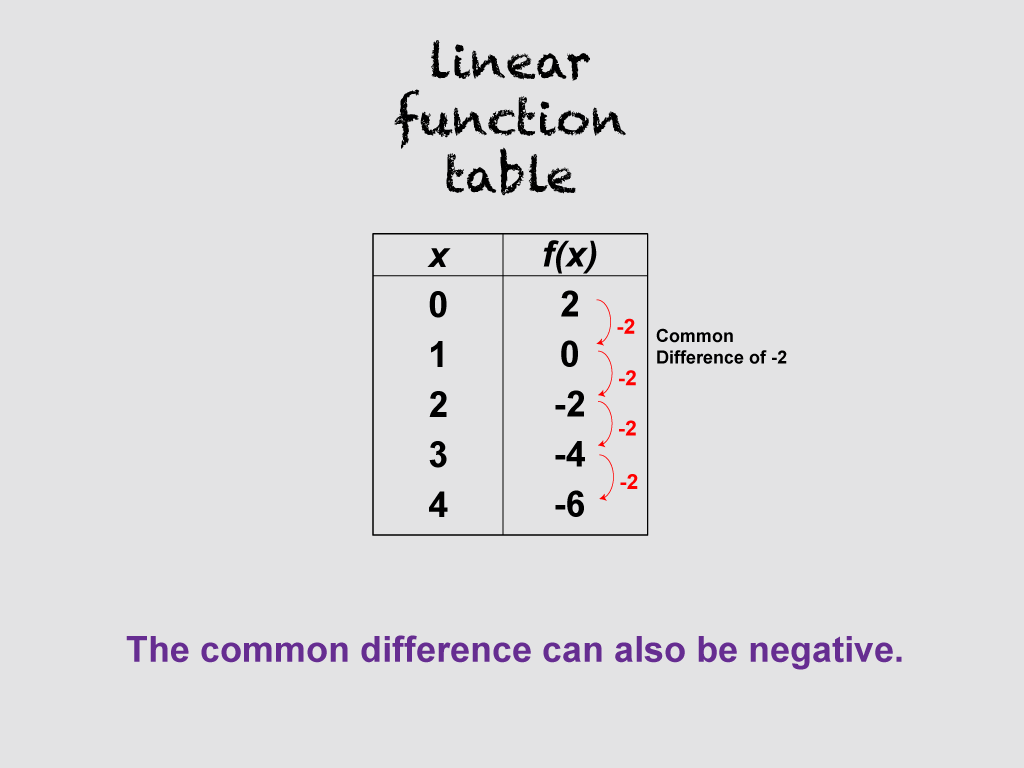
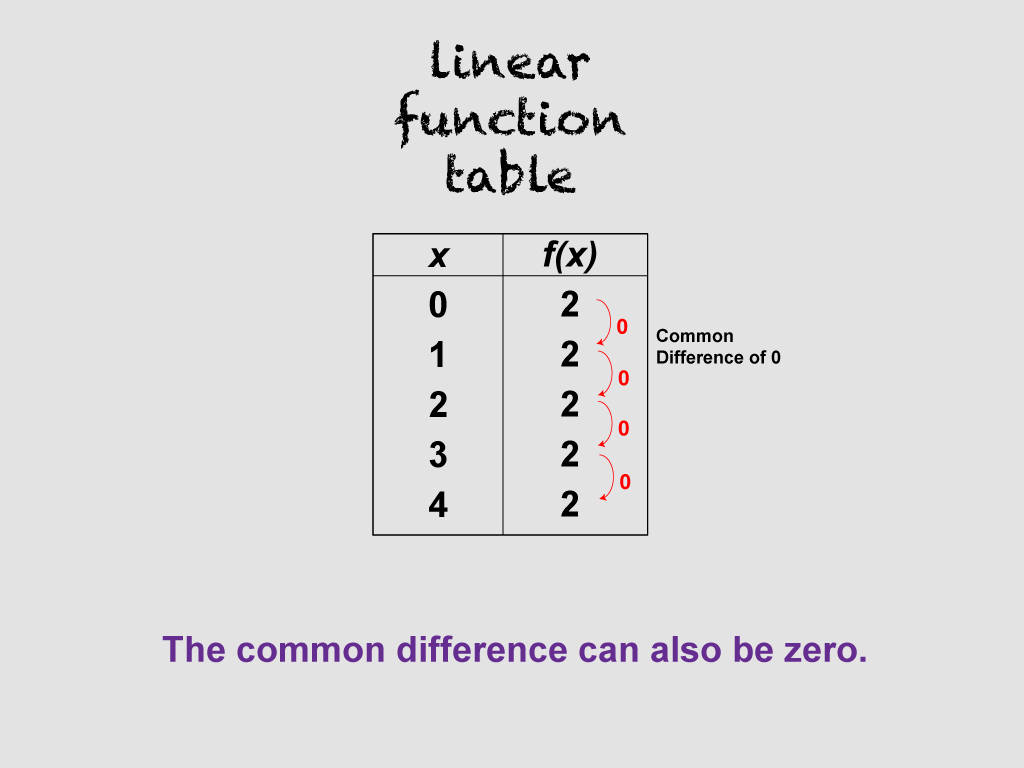
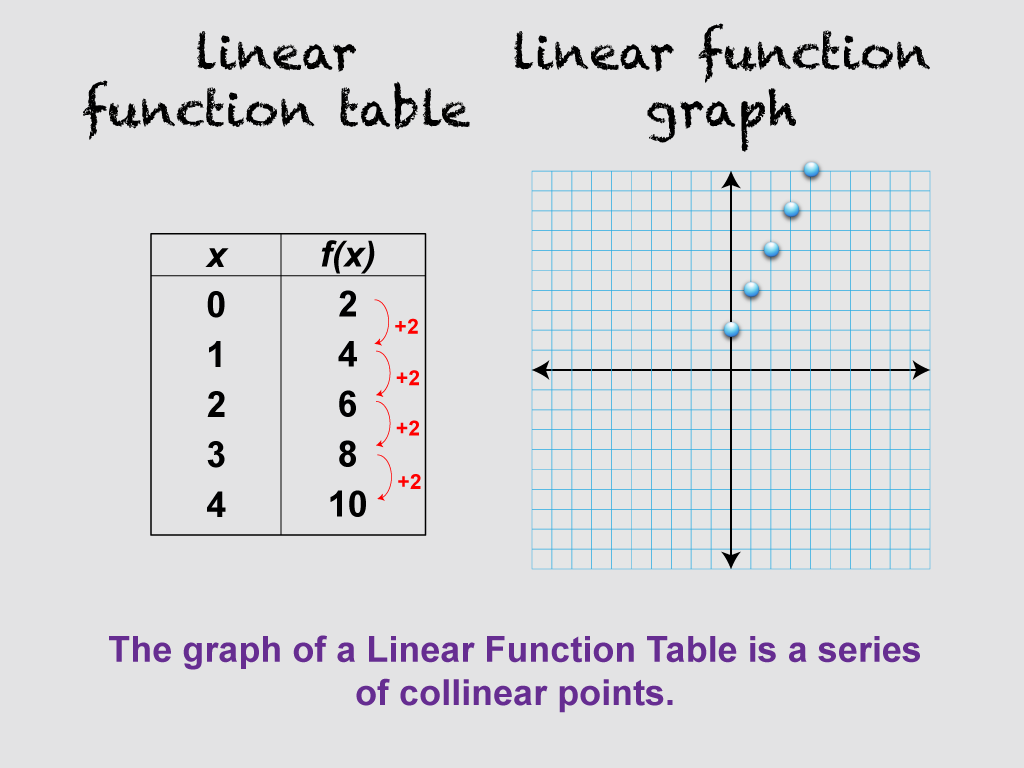
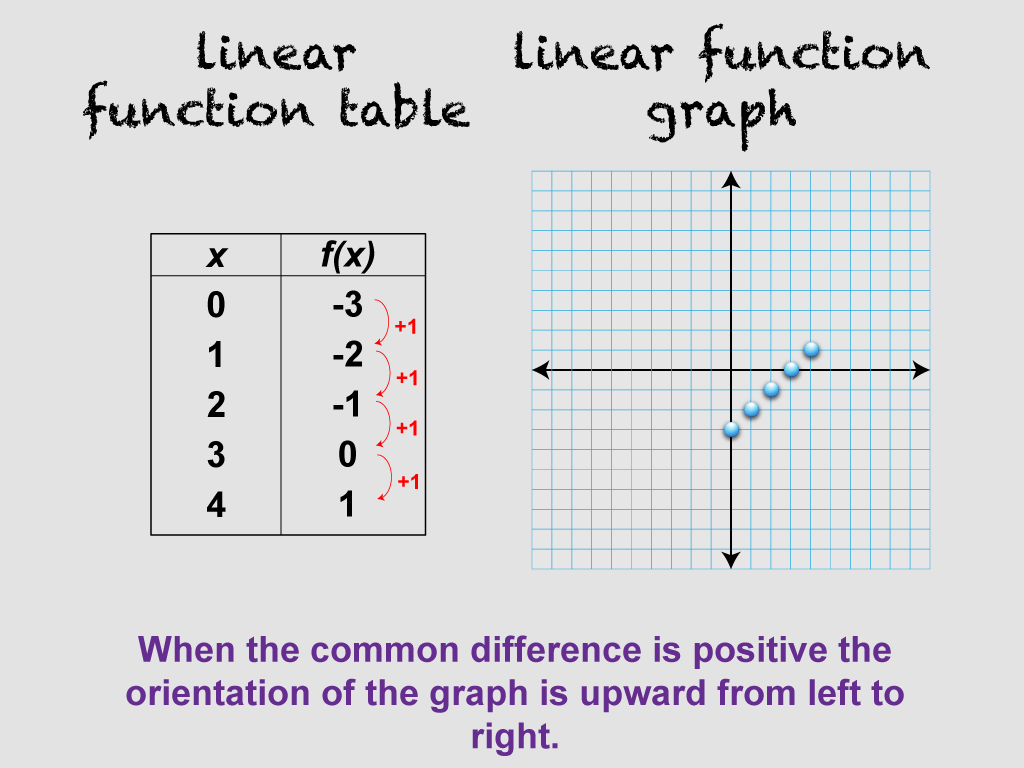
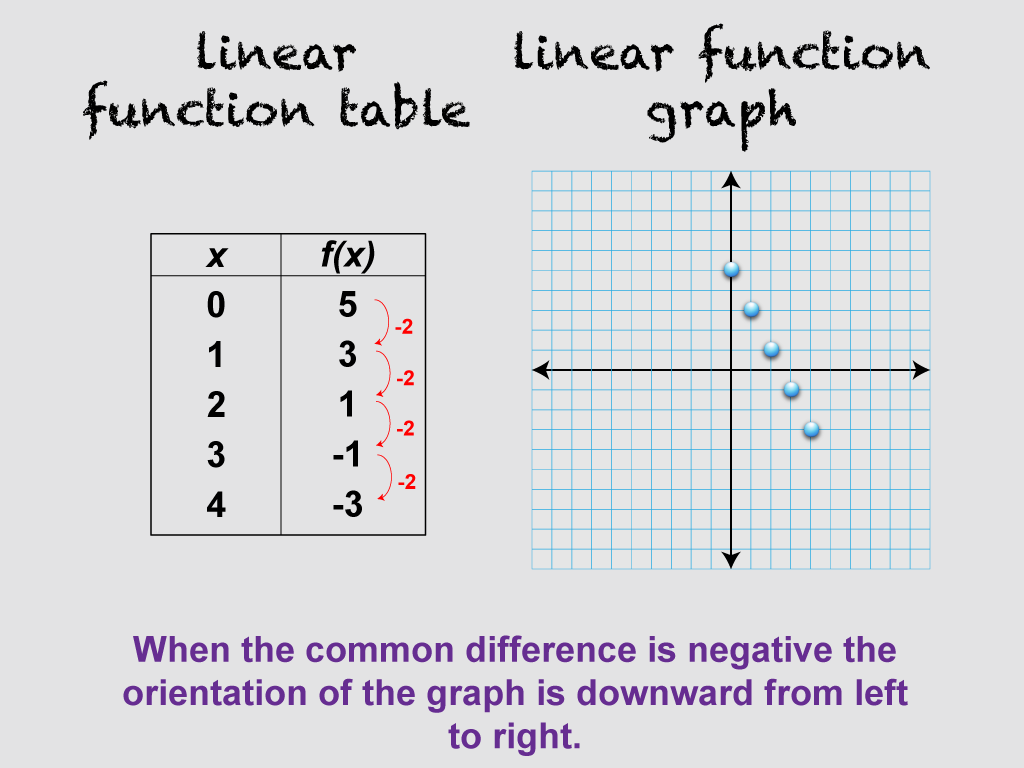
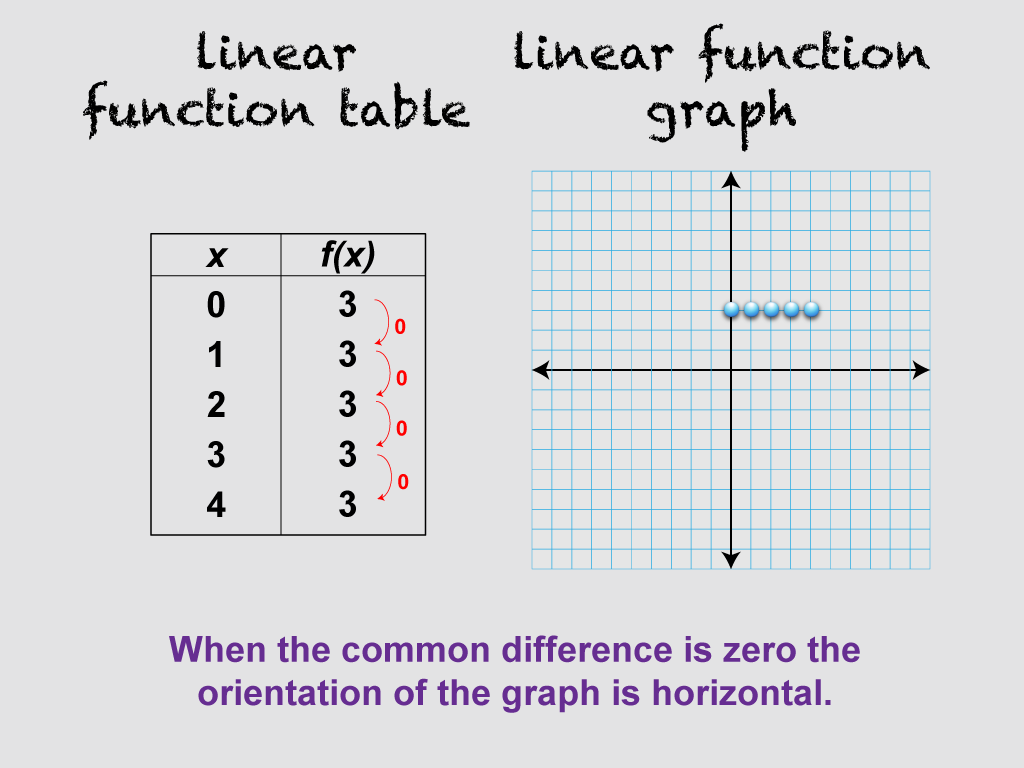
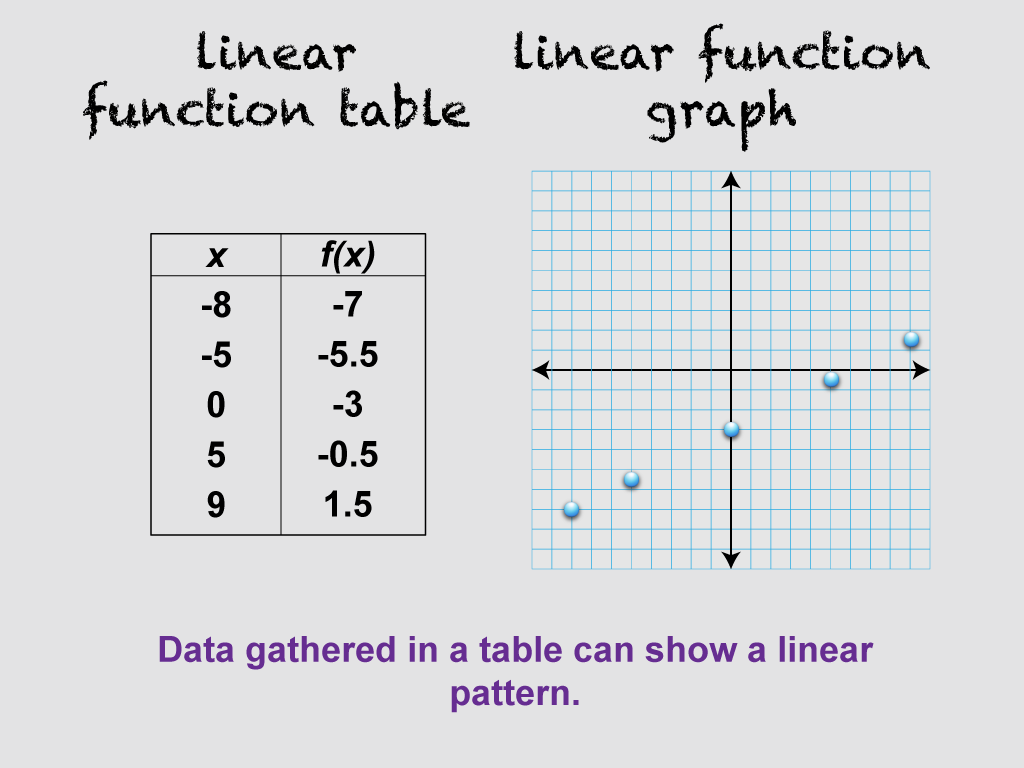
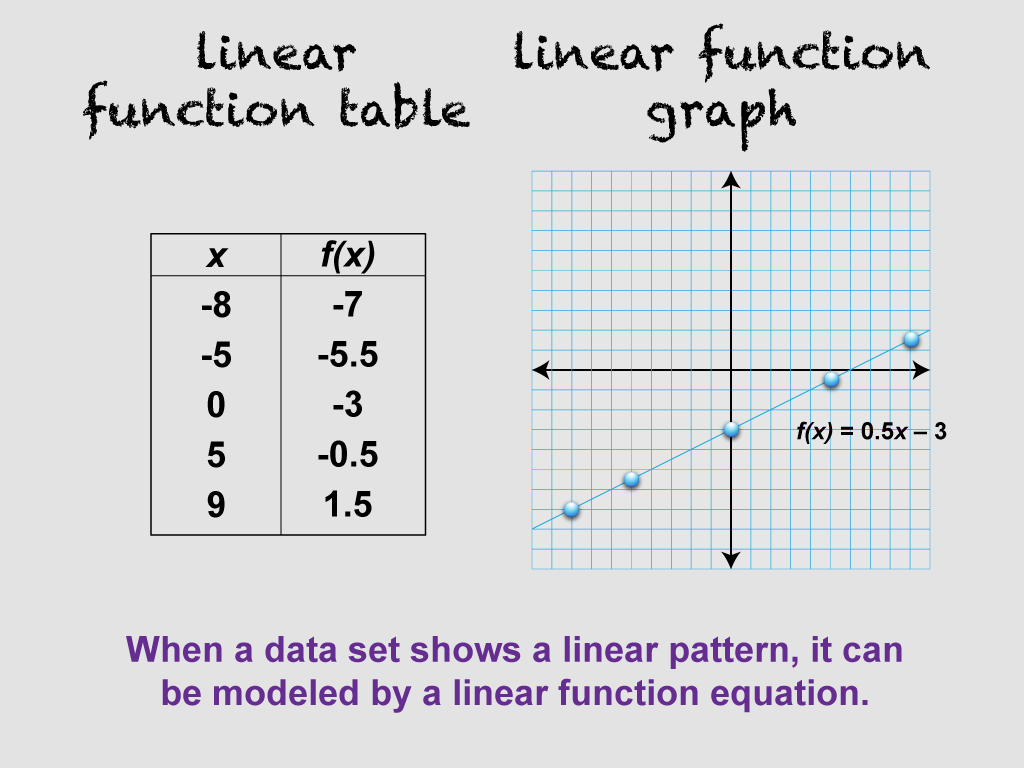
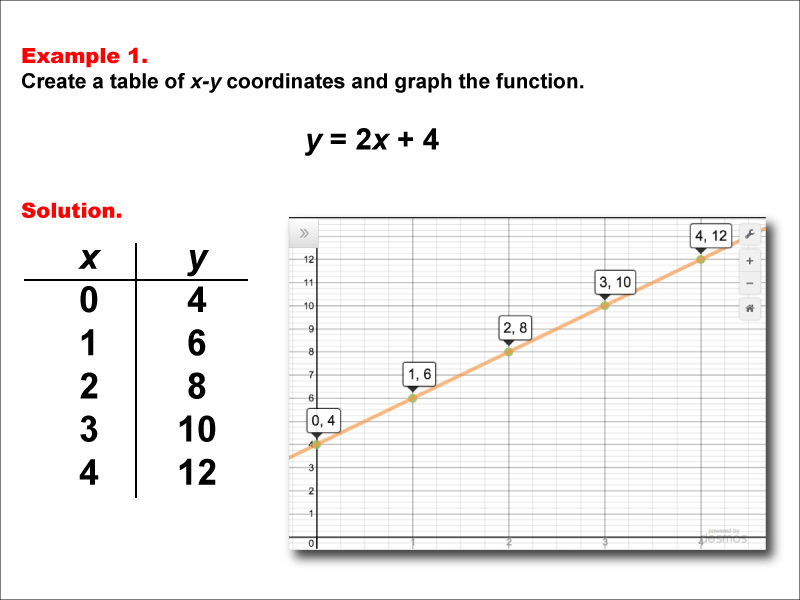
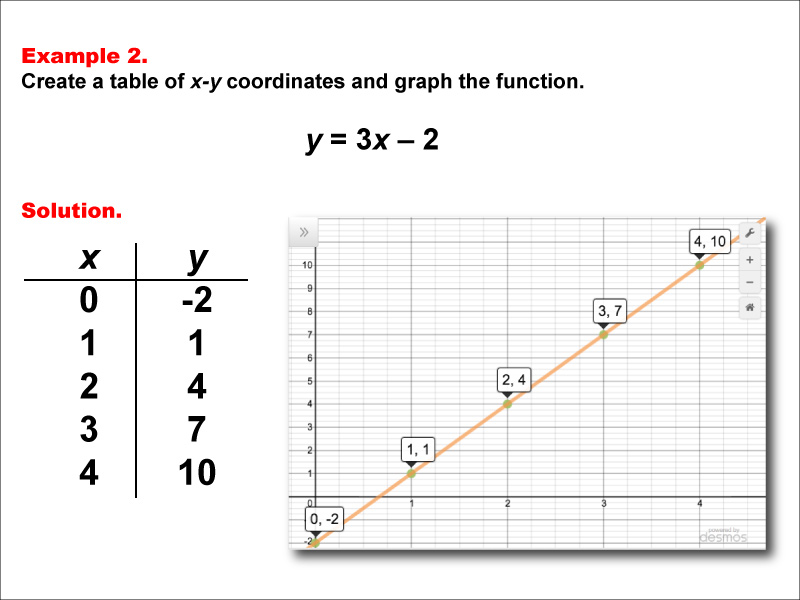
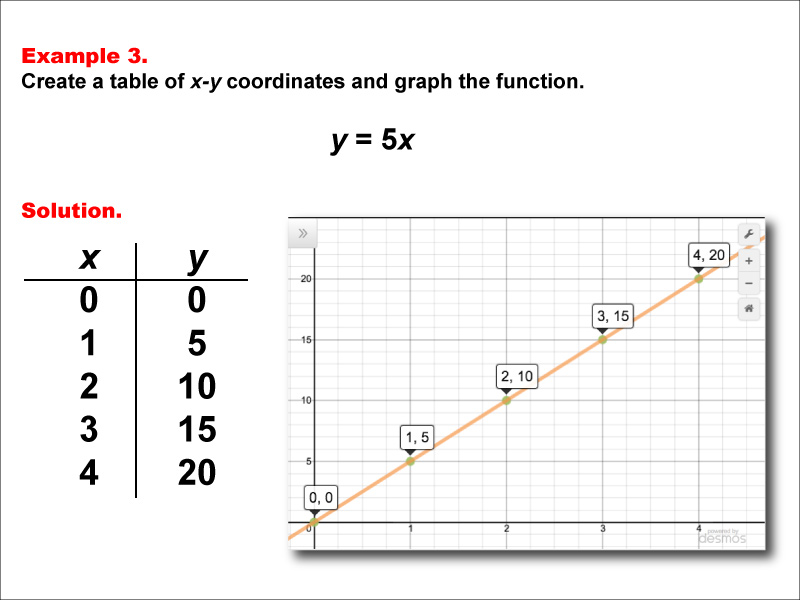
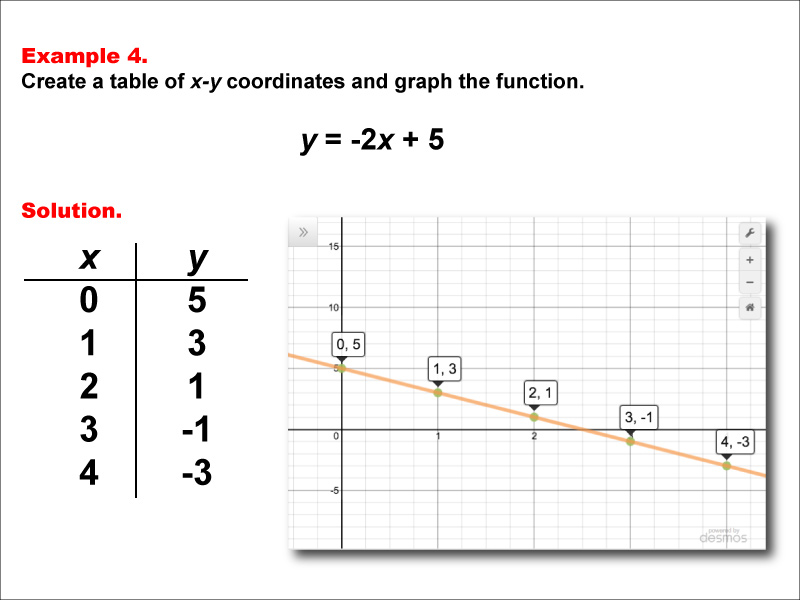
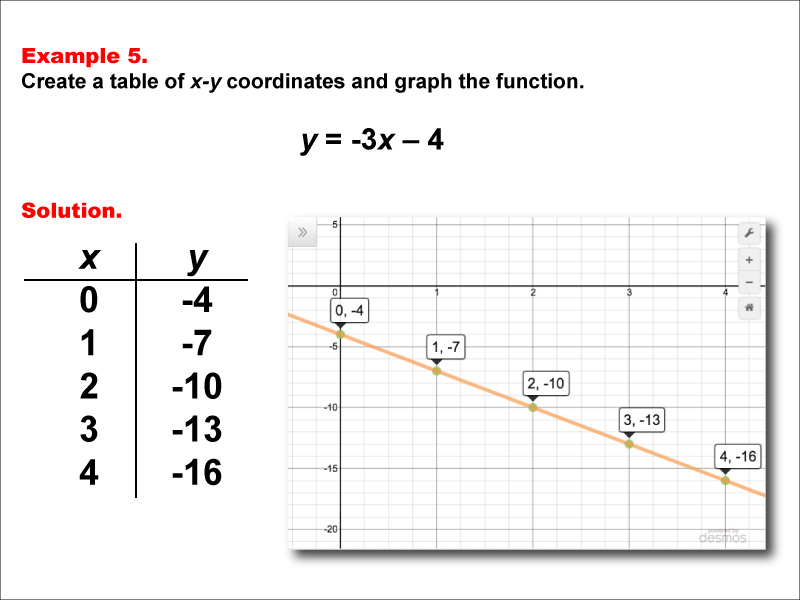
Student Tutorial: Linear Function Tables

Instructions:

Learn about linear function tables. Study the examples shown.

Click the arrows on the bottom to get started

Math Clip Art: Student Tutorial Title Page

Linear Function Tables. This is the title screen for this sequence of images..

A Linear Function Table shows a commondifference for values of f of x.

The common difference can also be negative.

The common difference can also be zero.

The graph of a Linear Function Table is a series of collinear points.

When the common difference is positive the orientation of the graph is upward from left to right.

When the common difference is negative the orientation of the graph is downward from left to right.

When the common difference is zero the orientation of the graph is horizontal.

Data gathered in a table can show a linear pattern.

When a data set shows a linear pattern, it can be modeled by a linear function equation.

Math Example--Linear Function Concepts--Linear Functions in Tabular and Graph Form: Example 1

Math Example--Linear Function Concepts--Linear Functions in Tabular and Graph Form: Example 2

Math Example--Linear Function Concepts--Linear Functions in Tabular and Graph Form: Example 3

Math Example--Linear Function Concepts--Linear Functions in Tabular and Graph Form: Example 4

Math Example--Linear Function Concepts--Linear Functions in Tabular and Graph Form: Example 5