Student Tutorial: Linear Function Models: Cricket Chirps

Instructions:

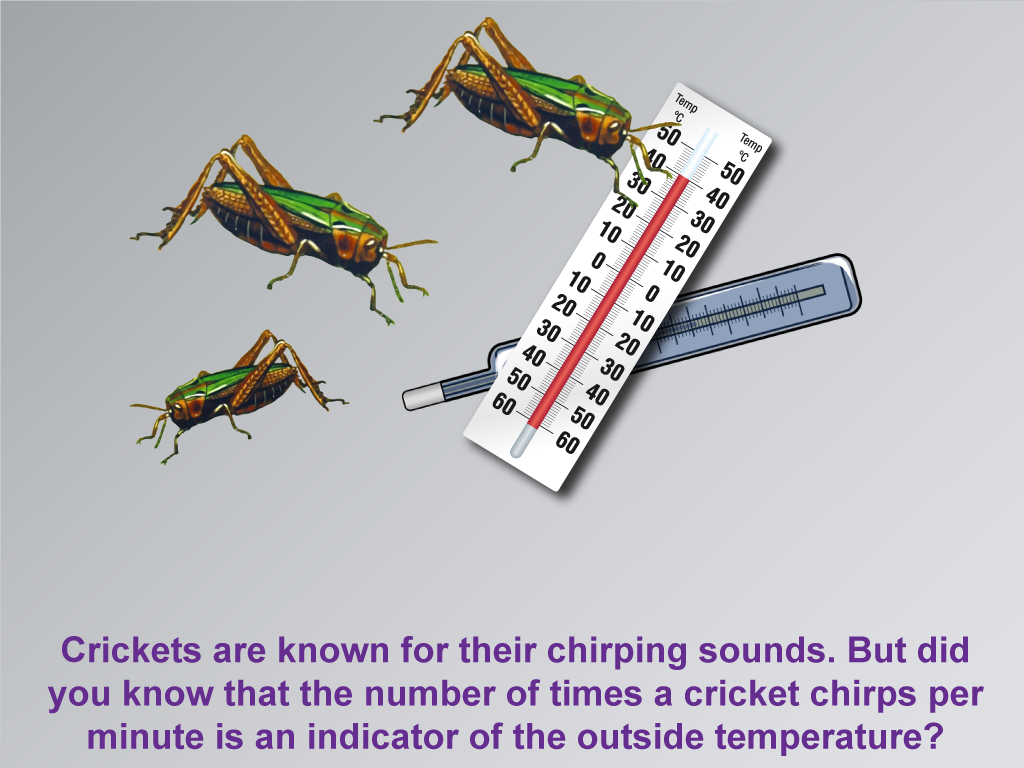
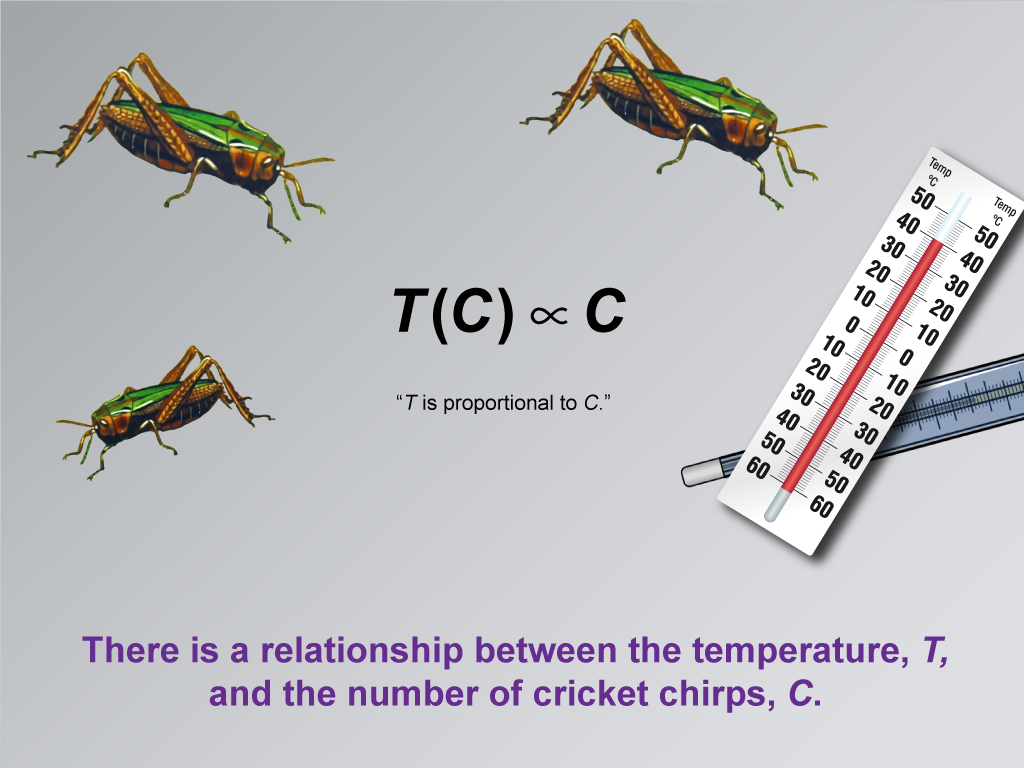
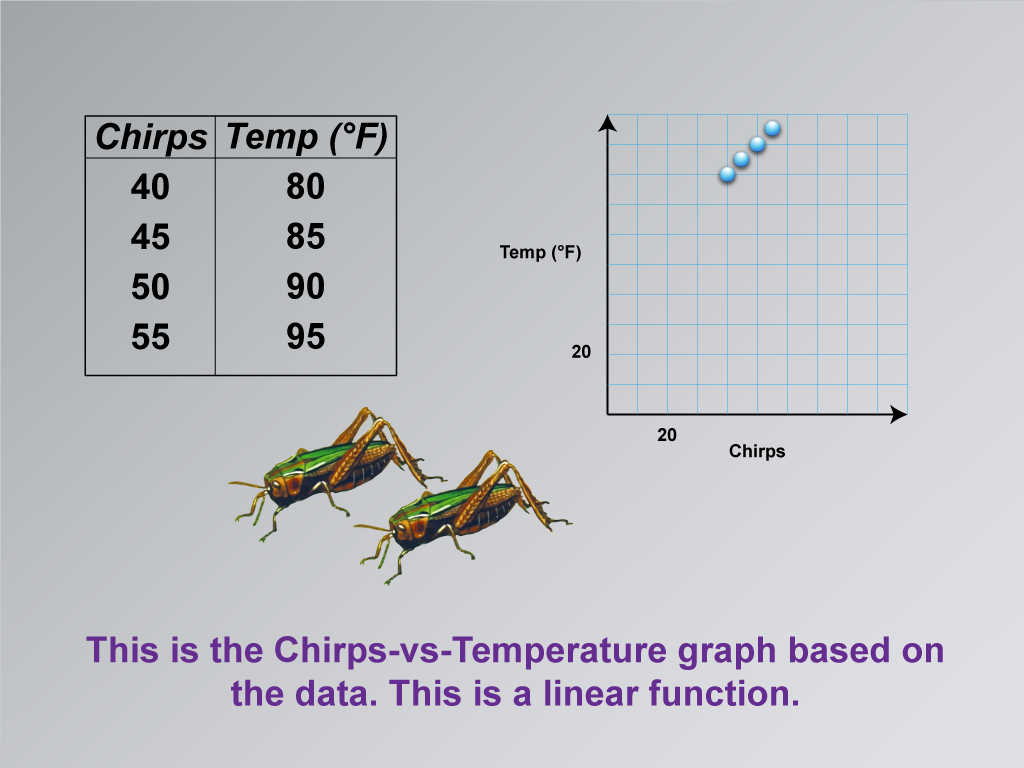
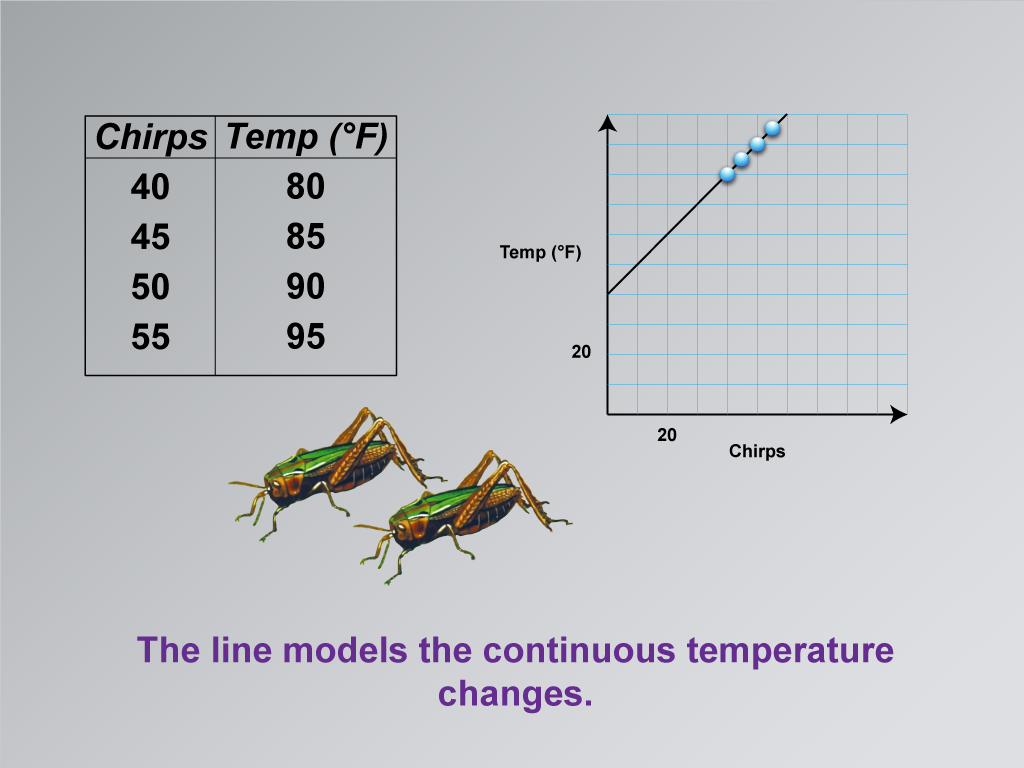
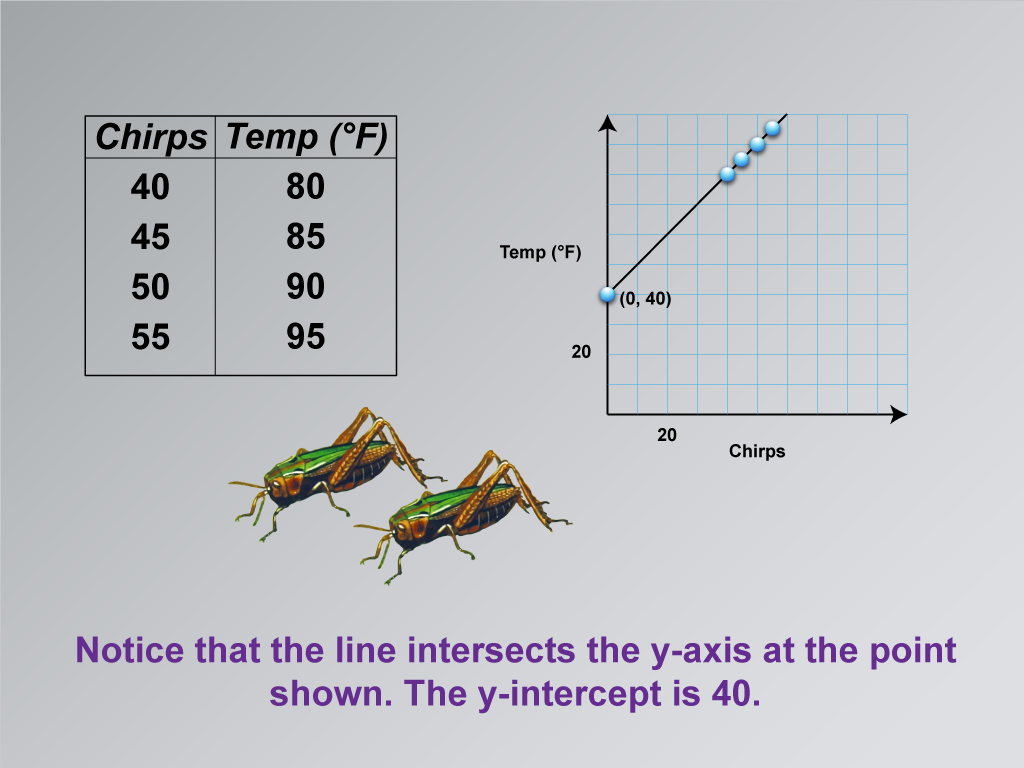
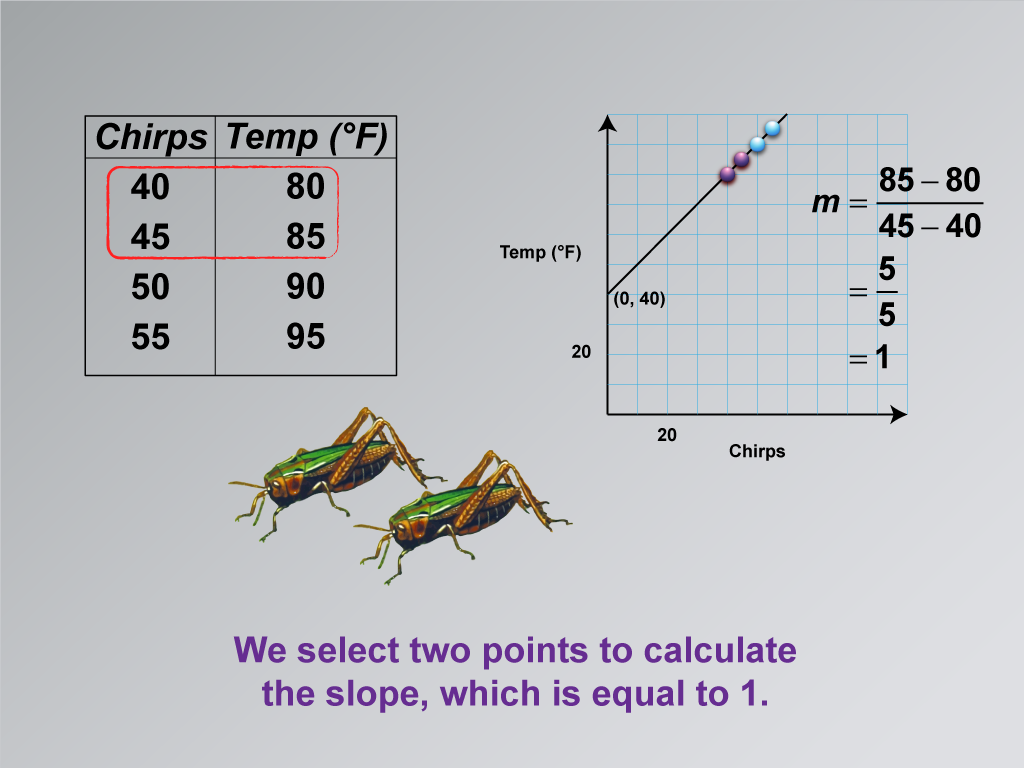
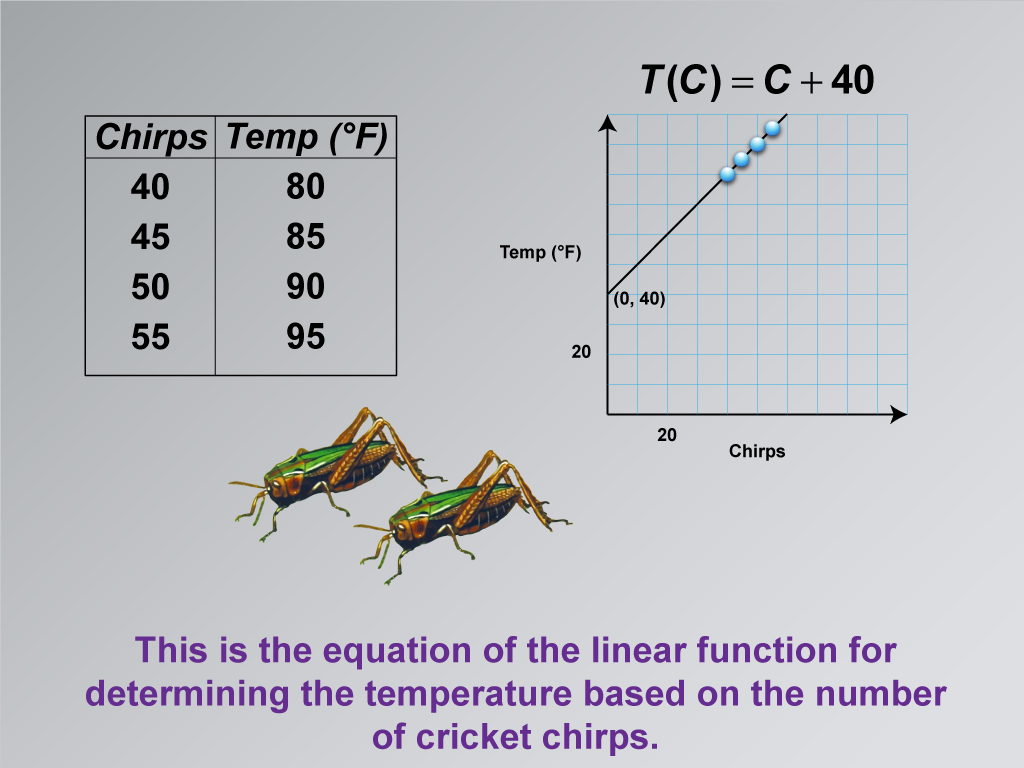
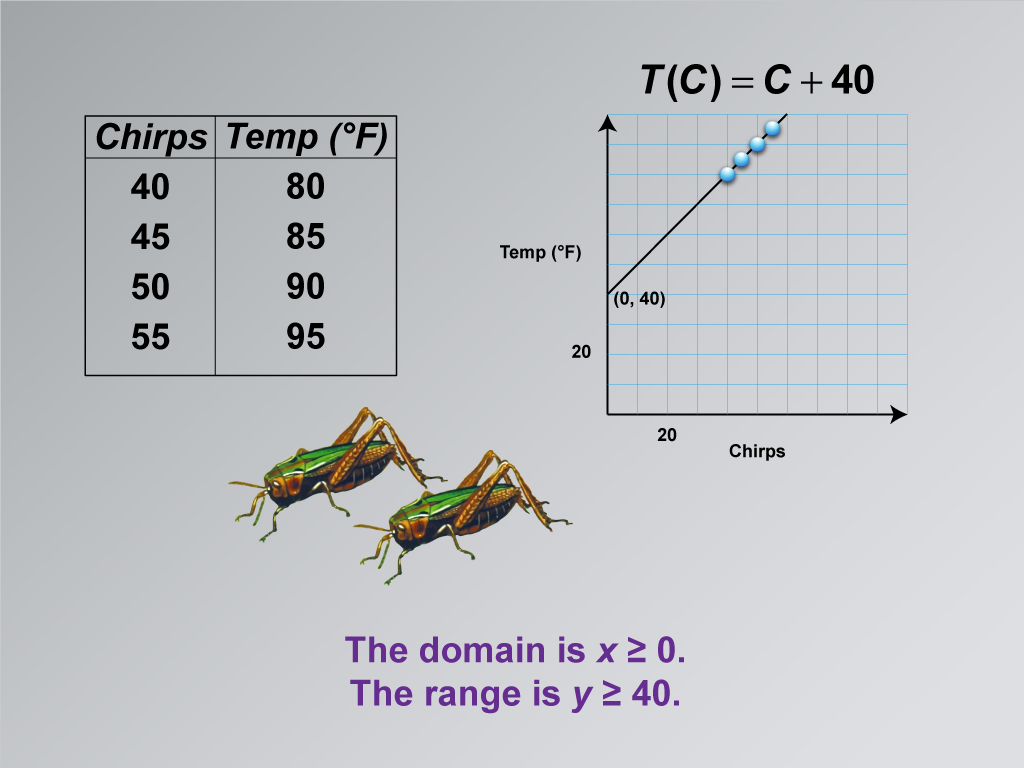
See an application of linear functions in the context of the relationship between cricket chirps and temperature. After you have studied these examples, try the Desmos graphing tool to graph additional functions: https://www.desmos.com/calculator.

Click the arrows on the bottom to get started

Math Clip Art: Student Tutorial Title Page

Math Clip Art--Applications of Linear Functions: Cricket Chirps, Image 1

Math Clip Art--Applications of Linear Functions: Cricket Chirps, Image 2

Cricket Chirps

This video describes the relationship between the number of cricket chirps and the outside temperature. This is an application of linear functions of the form y = mx + b. As you watch this video make a note of the following items:

  • Which is the independent variable?
  • Which is the dependent variable?
  • What is the relationship between the two variables.

The graph of the function is a line with a slope of m. Think of the domain and range of this function.

Math Clip Art--Applications of Linear Functions: Cricket Chirps, Image 3

Math Clip Art--Applications of Linear Functions: Cricket Chirps, Image 4

Use this template to explore Cricket Chirps-vs-Temperature graphs of the form y = mx + b.

Math Clip Art--Applications of Linear Functions: Cricket Chirps, Image 5

Math Clip Art--Applications of Linear Functions: Cricket Chirps, Image 6

Math Clip Art--Applications of Linear Functions: Cricket Chirps, Image 7

Math Clip Art--Applications of Linear Functions: Cricket Chirps, Image 8

Math Clip Art--Applications of Linear Functions: Cricket Chirps, Image 9

Math Clip Art--Applications of Linear Functions: Cricket Chirps, Image 10