Student Tutorial: Linear Function Models: Cost vs. Time

Instructions:

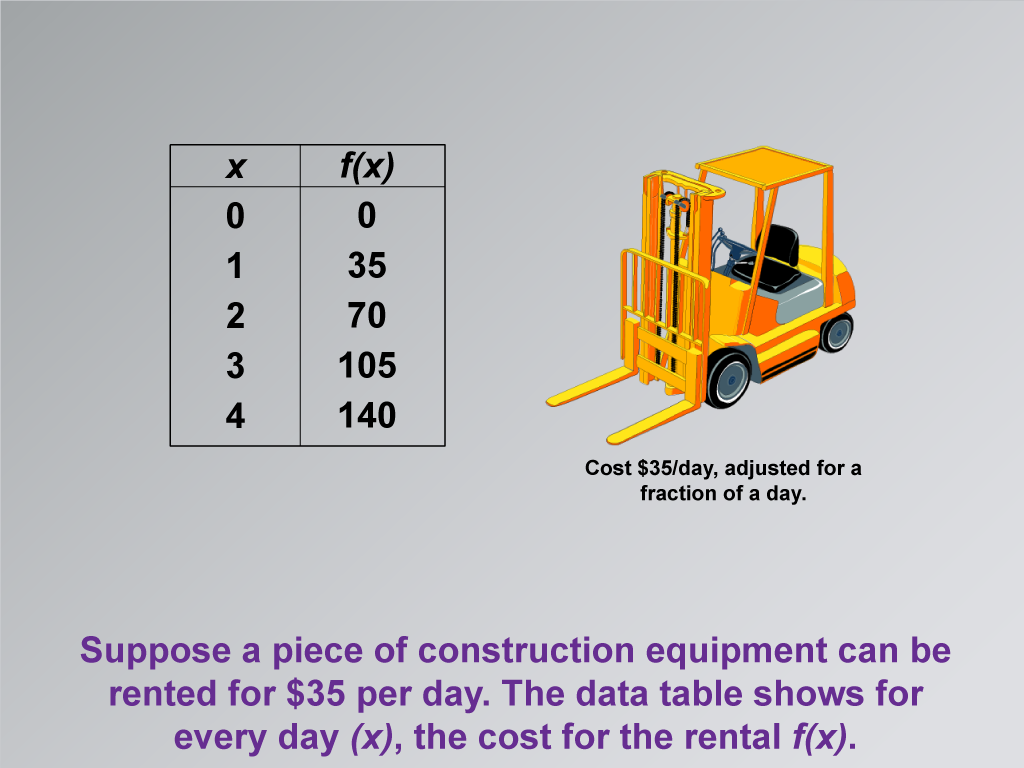
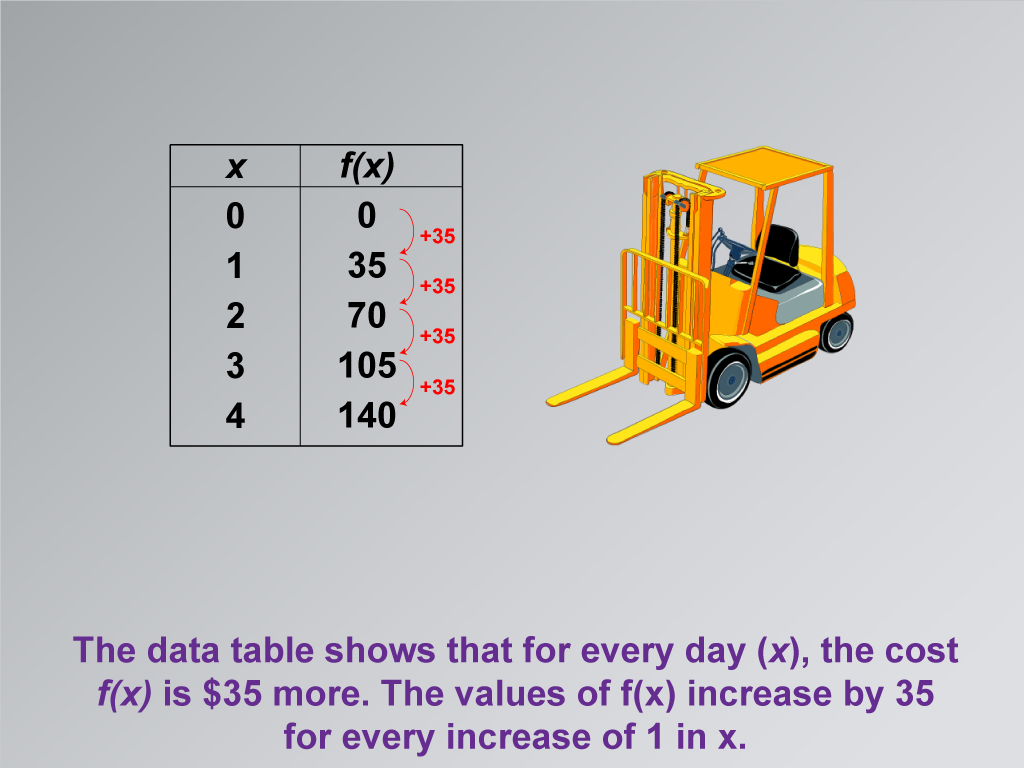
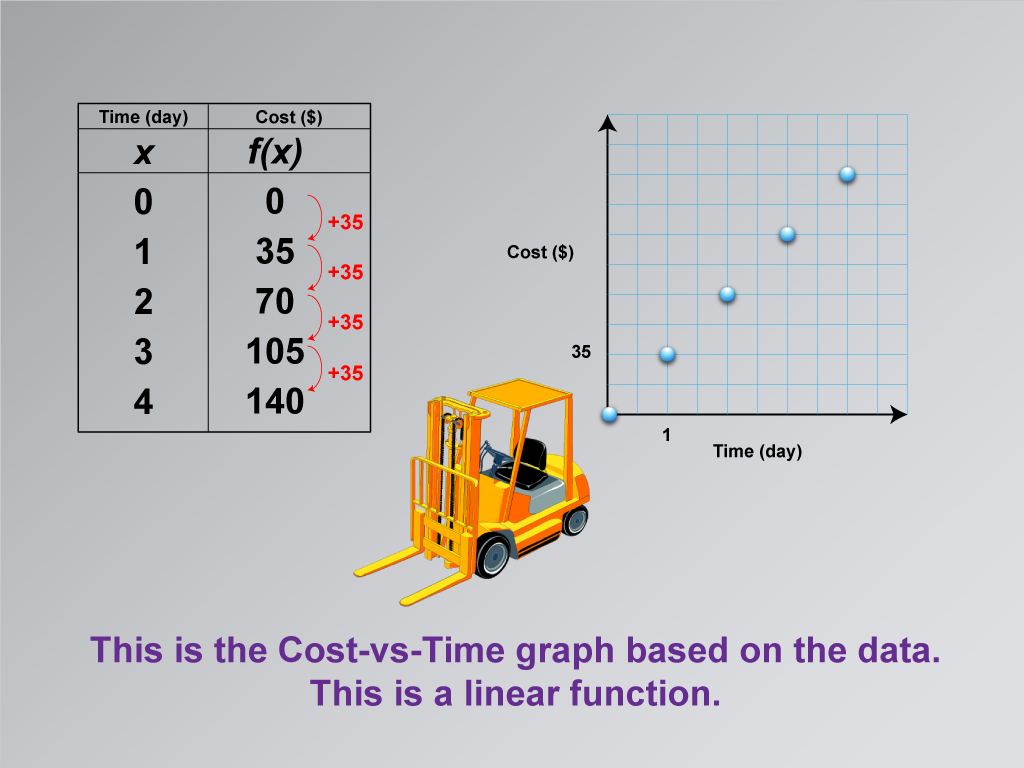
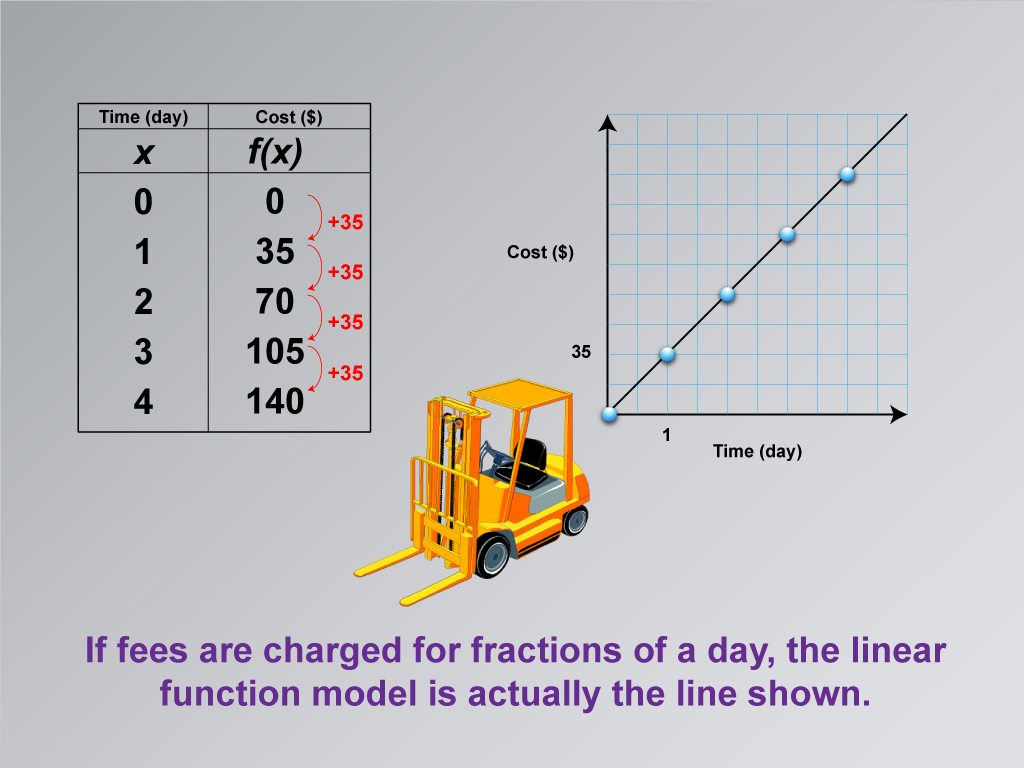
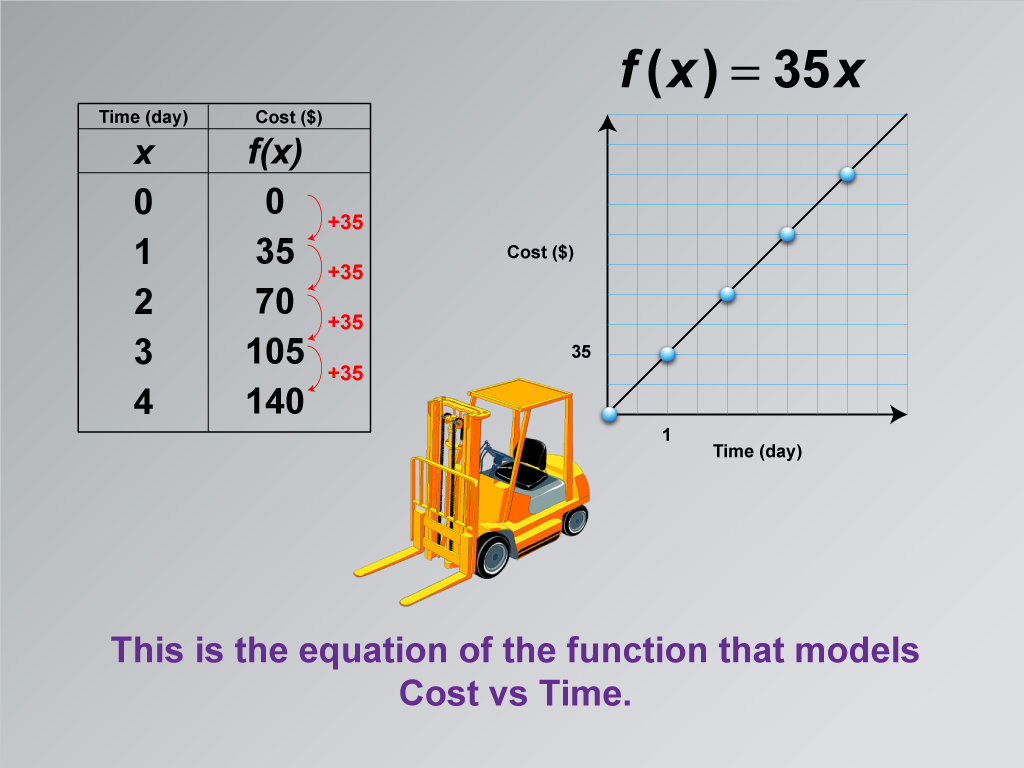
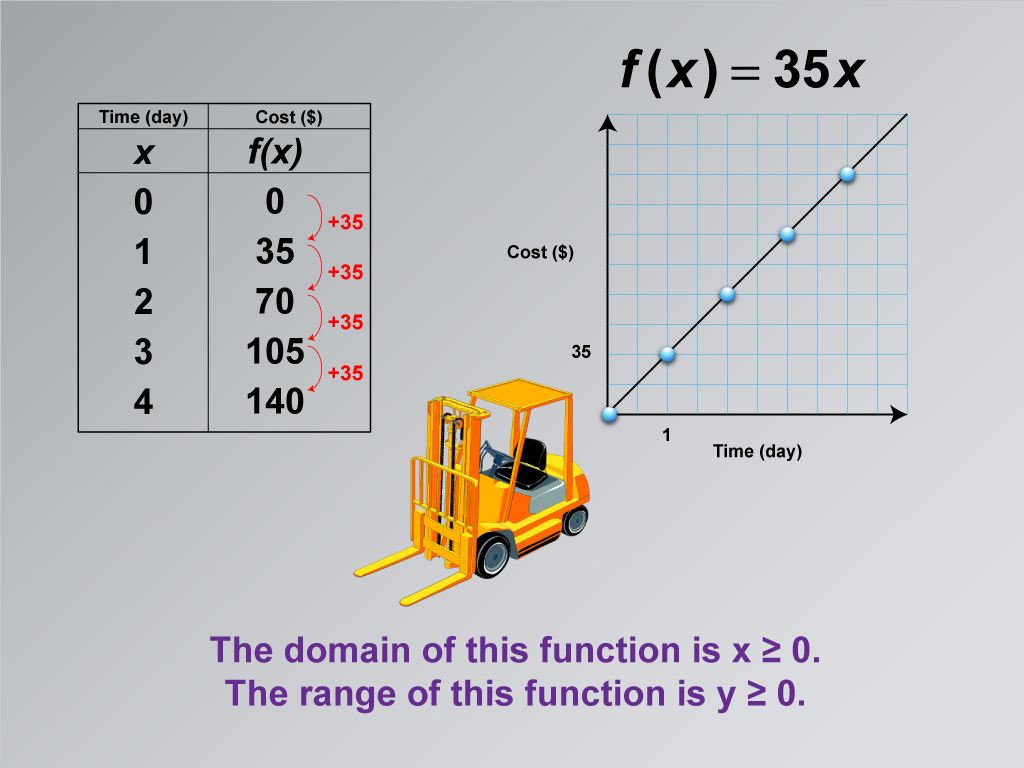
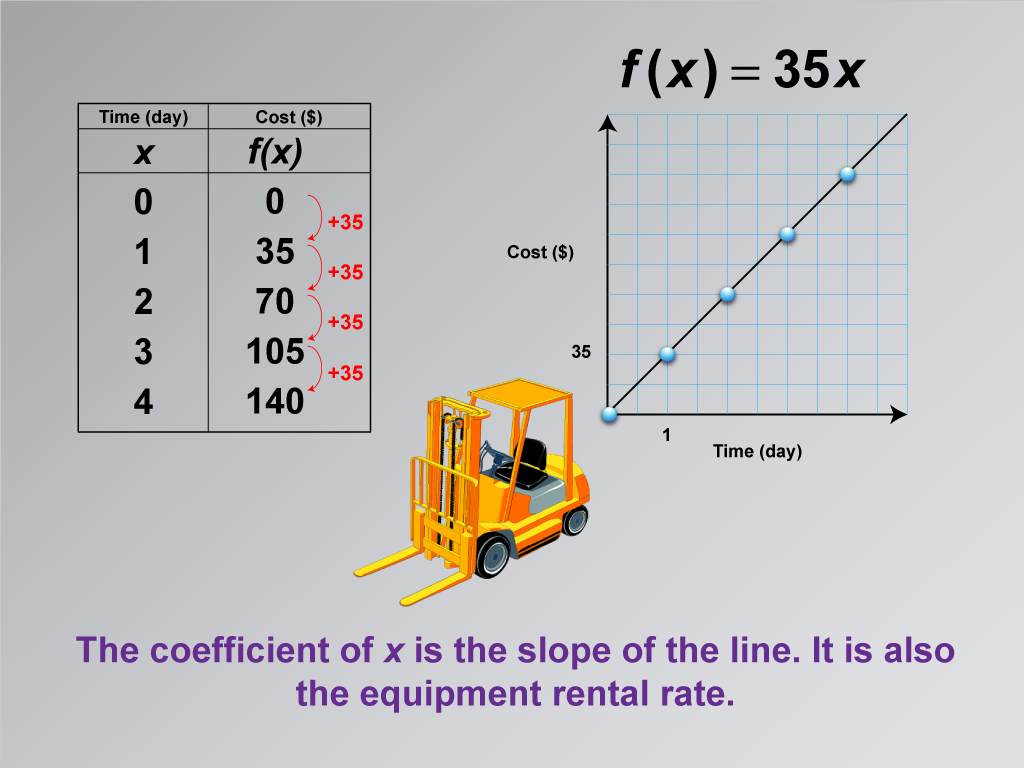
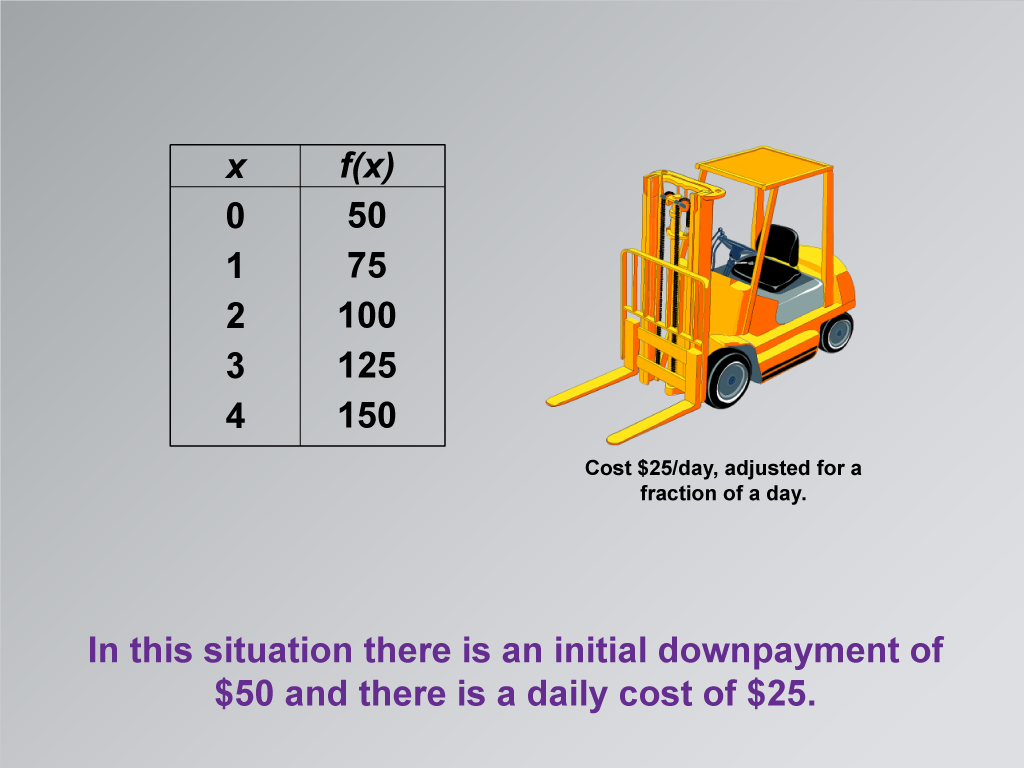
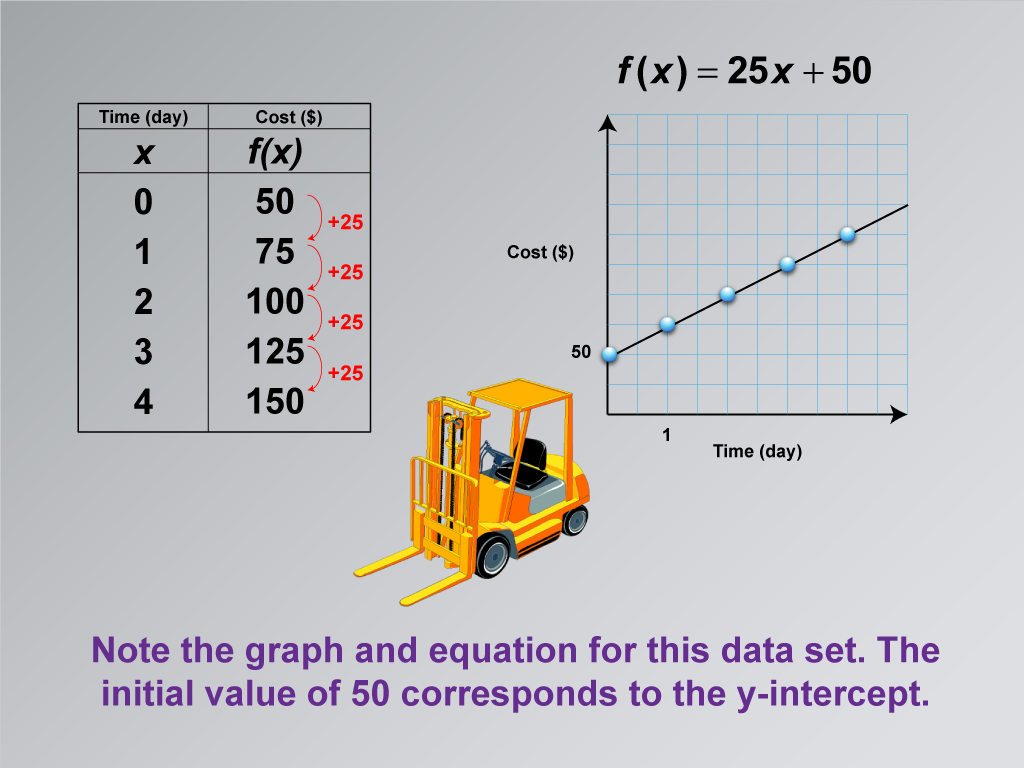
See an application of linear functions in the context of cost-vs-time graphs. After you have studied these examples, try the Desmos graphing tool to graph additional functions: https://www.desmos.com/calculator.

Click the arrows on the bottom to get started

Math Clip Art: Student Tutorial Title Page

Math Clip Art--Applications of Linear Functions: Cost vs. Time, Image 1

Math Clip Art--Applications of Linear Functions: Cost vs. Time, Image 2

Math Clip Art--Applications of Linear Functions: Cost vs. Time, Image 3

Math Clip Art--Applications of Linear Functions: Cost vs. Time, Image 4

Math Clip Art--Applications of Linear Functions: Cost vs. Time, Image 5

Math Clip Art--Applications of Linear Functions: Cost vs. Time, Image 6

Math Clip Art--Applications of Linear Functions: Cost vs. Time, Image 7

Math Clip Art--Applications of Linear Functions: Cost vs. Time, Image 8

Use this template to explore Cost-vs-Time graphs of the form y = mx.

Math Clip Art--Applications of Linear Functions: Cost vs. Time, Image 9

Math Clip Art--Applications of Linear Functions: Cost vs. Time, Image 10

Use this template to explore Cost-vs-Time graphs of the form y = mx + b.