Display Title
Math Example: Logarithmic Functions in Tabular and Graph Form: Example 50
Display Title
Math Example: Logarithmic Functions in Tabular and Graph Form: Example 50
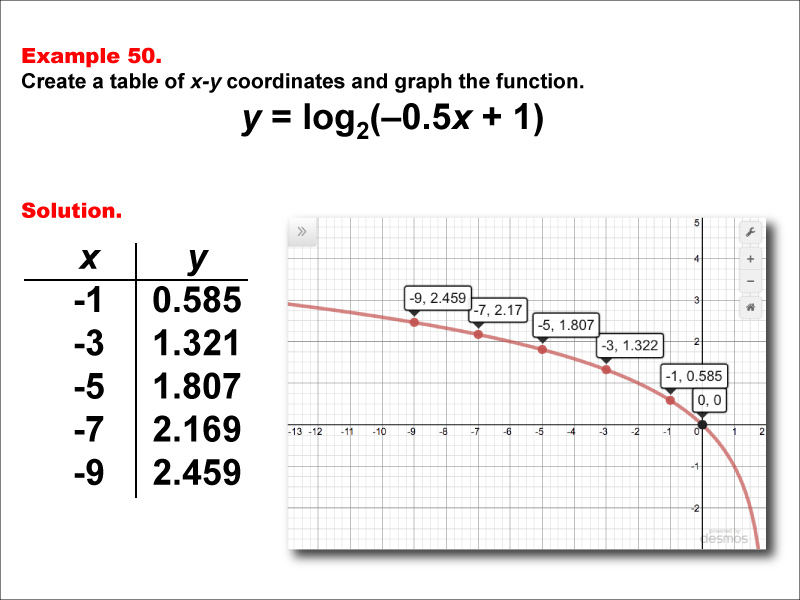
Math Example: Logarithmic Functions in Tabular and Graph Form: Example 50
This is part of a collection of math examples that focus on logarithmic functions in tabular and graphic form.
To see the complete math example collection on this topic, click on this link.
Note: The download is an image file.
Related Resources
To see additional resources on this topic, click on the Related Resources tab.
Create a Slide Show
Subscribers can use Slide Show Creator to create a slide show from the complete collection of math examples on this topic. To learn more about Slide Show Creator, click on this Link:
Accessibility
This resource can also be used with a screen reader. Follow these steps.
-
Click on the Accessibility icon on the upper-right part of the screen.

-
From the menu, click on the Screen Reader button. Then close the Accessibility menu.

-
Click on the PREVIEW button on the left and then click on the definition card. The Screen Reader will read the definition.
| Common Core Standards | CCSS.MATH.CONTENT.HSF.IF.A.1, CCSS.MATH.CONTENT.HSF.IF.B.5, CCSS.MATH.CONTENT.HSF.IF.C.7.E |
|---|---|
| Grade Range | 9 - 12 |
| Curriculum Nodes |
Algebra • Exponential and Logarithmic Functions • Exponential and Logarithmic Functions and Equations |
| Copyright Year | 2015 |
| Keywords | function, logarithmic functions, graphs of logarithmic functions, logarithmic function tables |