Using the Unit Circle to Generate Trig Functions
For this activity we will be exploring the unit circle using the Desmos graphing calculator. If you have another graphing tool, you’ll still be able to use it, but Desmos offers the ability to animate points on the graph, which we will be using in this exploration.
What is a unit circle? It is a circle of radius 1.
This is the equation for the unit circle.
We know that 12 is the same as 1, but writing the equation this way reminds you that the radius, no matter its value, is squared.
Here is the graph of this equation.
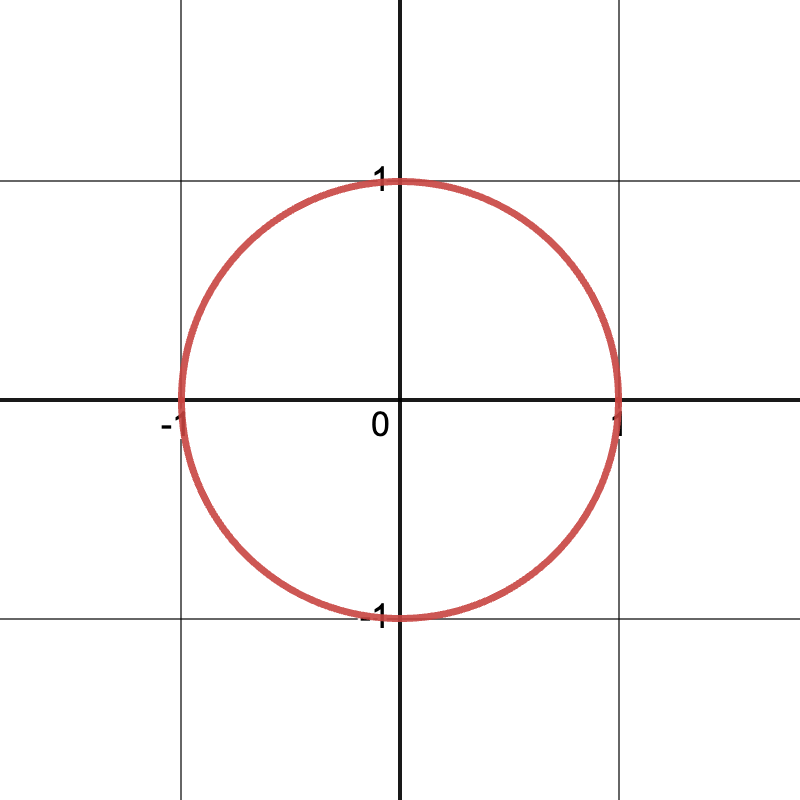
It may not be obvious from the equation, but it is from the graph, that the equation of a circle is NOT a function. As you can see, the circle does not pass the Vertical Line Test. In fact, the equation of a circle is an example of a quadratic relation.
Think of a point on the circle as if it’s a satellite orbiting the Earth. At any point, the coordinates are found using the following trigonometric calculations.
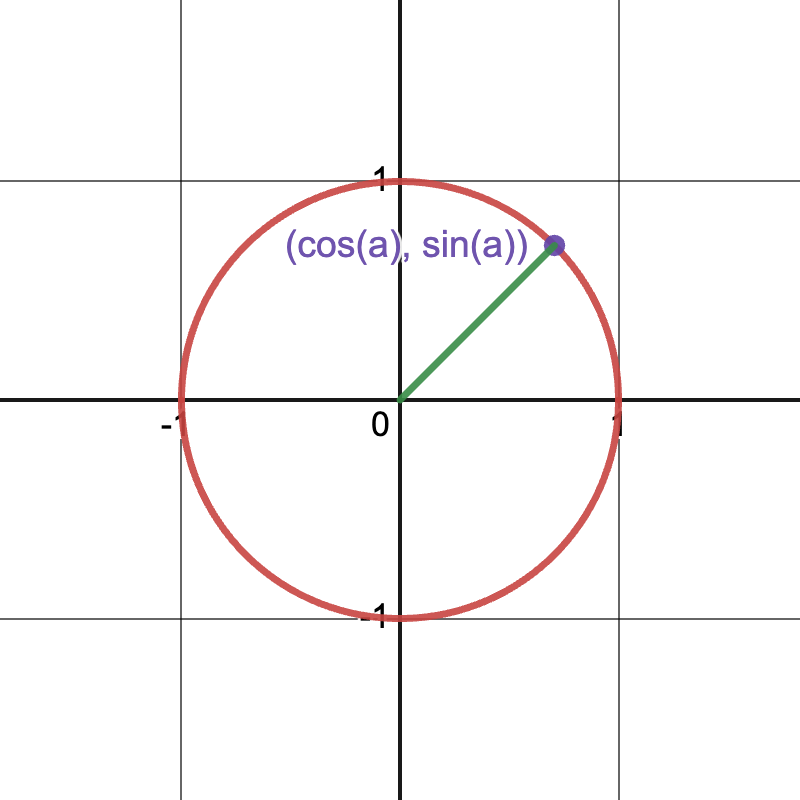
In the illustration above, a is the angle formed by the segment connecting the origin and the point on the circle. The angle can be measured in degrees or radians.
For this activity, we’ll use radians. If we let a range from 0 to 2π, in Desmos you can create an animation that shows the point going around the circle indefinitely.

In this animation you’ll see that the point continues to circle around the radius indefinitely. This is our first indication that circular functions, once we define them, have the property of being periodic.
Here is the Desmos activity. Click on the play button next to a to start the animation.
The Domain
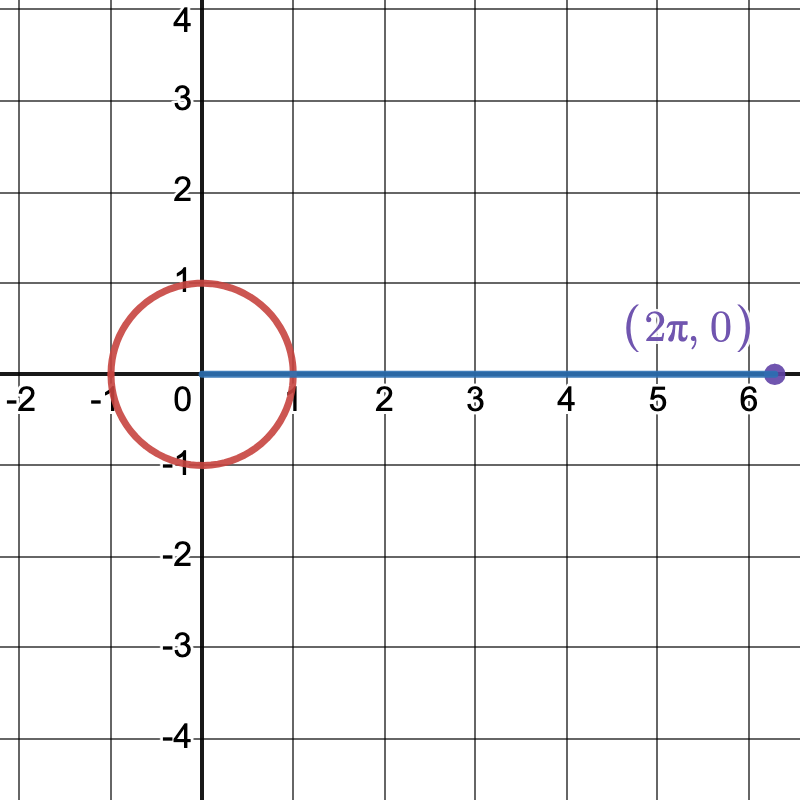
As you study the point going in a circle, with each sweep, the domain goes from 0 to 2π radians. This is our first step in defining a trigonometric function.
In this graph, we define the interval for the domain of our trigonometric function to be this same interval, which is highlighted by the blue line.
The Range
As the value of x goes from 0 to 2π, what happens to y? In this animated sequence, you can see how y changes as the point moves around the circle

During one cycle of the point going around the circle, this is what happens:
- The value of x goes from 0 to 2π.
- The value of y goes from -1 to 1.
The Sine Function
We combine the changes in x and y into one animated sequence, shown below.
What does this function look like? Here is the Desmos activity where you can explore the sine function.
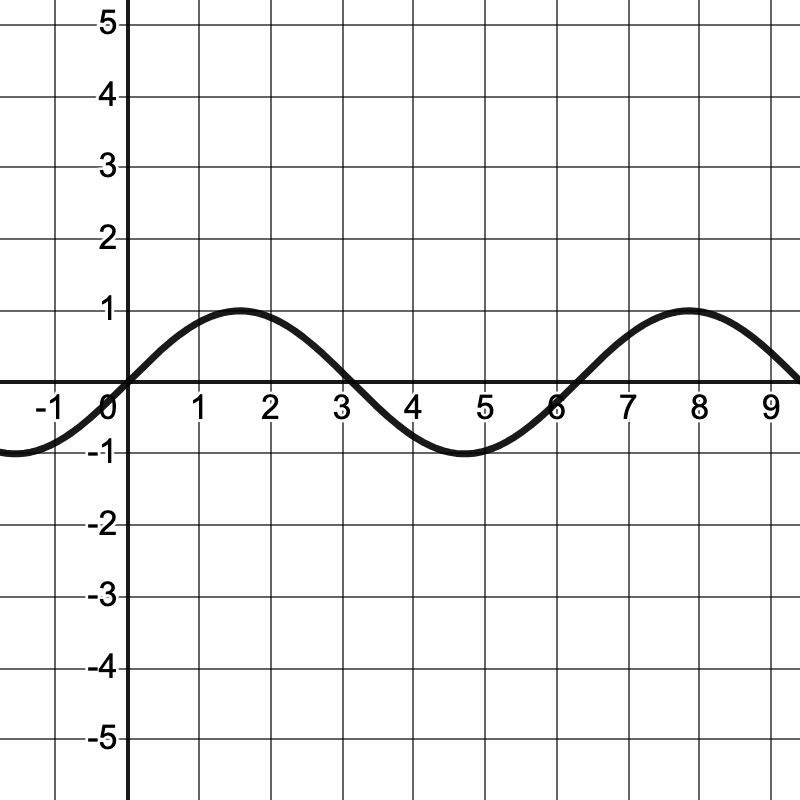
But the sine function in the graph is just for the domain interval of 0 ≤ x ≤ 2π. If you don’t restrict the domain, then this is what the sine function looks like.
Other Trig Functions
Use the Desmos activity to see if you can model the cosine function, as shown here.
Then try the tangent function, as shown here.