Digital Resources on the Topic of Exponential and Logarithmic Functions
|
|
| Thumbnail Image | Description | |
|---|---|---|
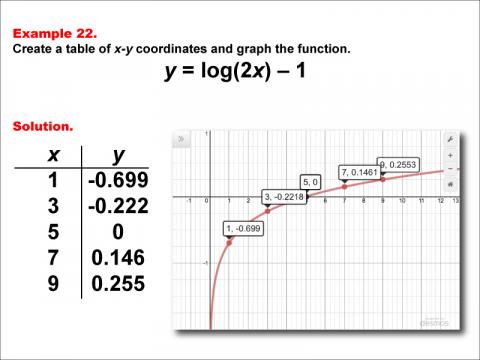
Math Example: Logarithmic Functions in Tabular and Graph Form: Example 22 |
|
Math Example: Logarithmic Functions in Tabular and Graph Form: Example 22
This is part of a collection of math examples that focus on logarithmic functions in tabular and graphic form. |
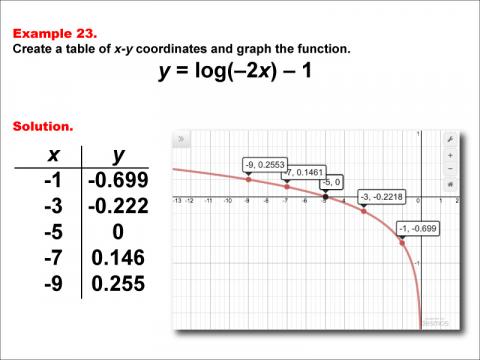
Math Example: Logarithmic Functions in Tabular and Graph Form: Example 23 |
|
Math Example: Logarithmic Functions in Tabular and Graph Form: Example 23
This is part of a collection of math examples that focus on logarithmic functions in tabular and graphic form. |
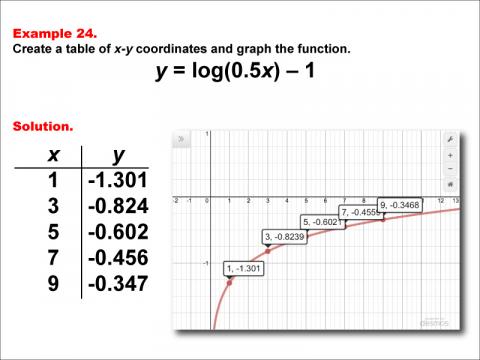
Math Example: Logarithmic Functions in Tabular and Graph Form: Example 24 |
|
Math Example: Logarithmic Functions in Tabular and Graph Form: Example 24
This is part of a collection of math examples that focus on logarithmic functions in tabular and graphic form. |
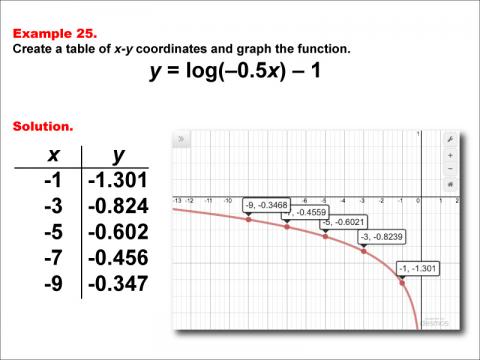
Math Example: Logarithmic Functions in Tabular and Graph Form: Example 25 |
|
Math Example: Logarithmic Functions in Tabular and Graph Form: Example 25
This is part of a collection of math examples that focus on logarithmic functions in tabular and graphic form. |
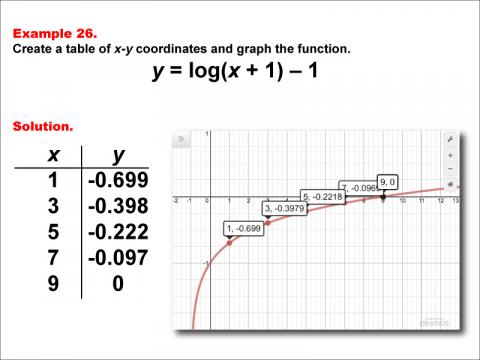
Math Example: Logarithmic Functions in Tabular and Graph Form: Example 26 |
|
Math Example: Logarithmic Functions in Tabular and Graph Form: Example 26
This is part of a collection of math examples that focus on logarithmic functions in tabular and graphic form. |
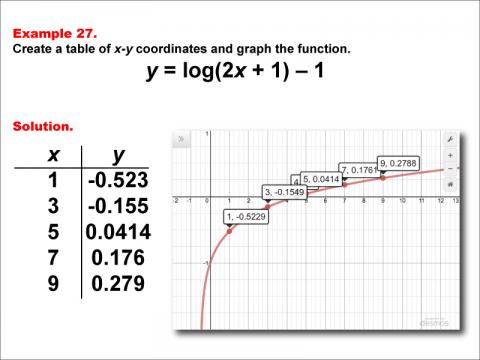
Math Example: Logarithmic Functions in Tabular and Graph Form: Example 27 |
|
Math Example: Logarithmic Functions in Tabular and Graph Form: Example 27
This is part of a collection of math examples that focus on logarithmic functions in tabular and graphic form. |
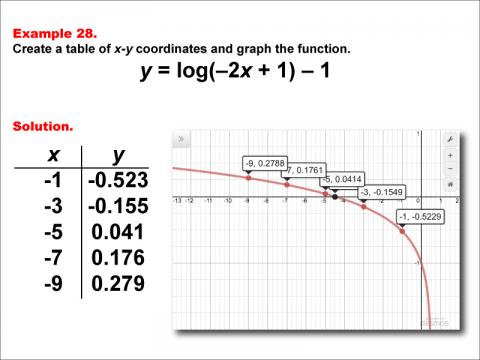
Math Example: Logarithmic Functions in Tabular and Graph Form: Example 28 |
|
Math Example: Logarithmic Functions in Tabular and Graph Form: Example 28
This is part of a collection of math examples that focus on logarithmic functions in tabular and graphic form. |
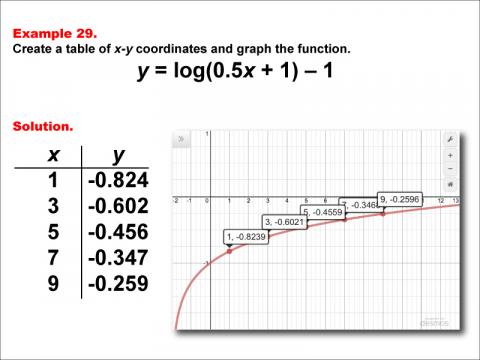
Math Example: Logarithmic Functions in Tabular and Graph Form: Example 29 |
|
Math Example: Logarithmic Functions in Tabular and Graph Form: Example 29
This is part of a collection of math examples that focus on logarithmic functions in tabular and graphic form. |
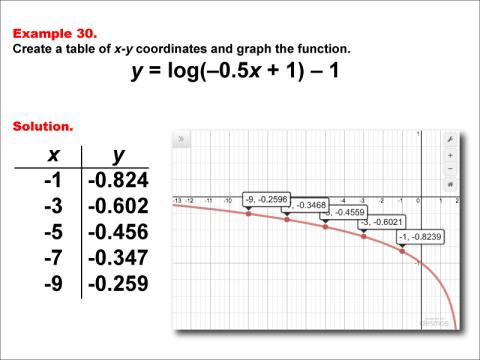
Math Example: Logarithmic Functions in Tabular and Graph Form: Example 30 |
|
Math Example: Logarithmic Functions in Tabular and Graph Form: Example 30
This is part of a collection of math examples that focus on logarithmic functions in tabular and graphic form. |
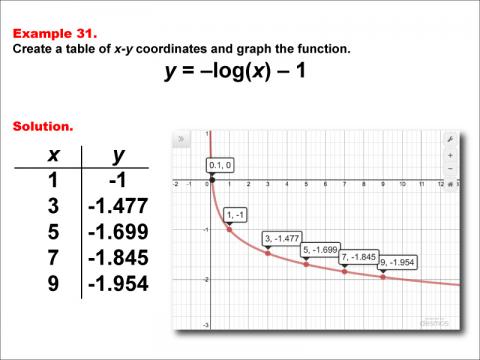
Math Example: Logarithmic Functions in Tabular and Graph Form: Example 31 |
|
Math Example: Logarithmic Functions in Tabular and Graph Form: Example 31
This is part of a collection of math examples that focus on logarithmic functions in tabular and graphic form. |
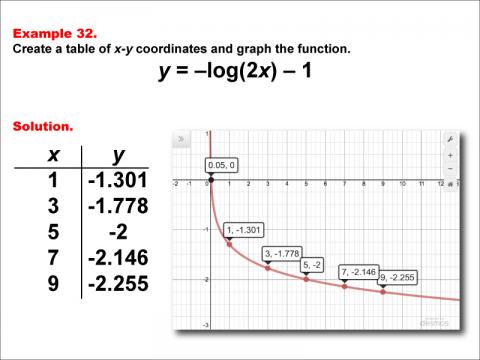
Math Example: Logarithmic Functions in Tabular and Graph Form: Example 32 |
|
Math Example: Logarithmic Functions in Tabular and Graph Form: Example 32
This is part of a collection of math examples that focus on logarithmic functions in tabular and graphic form. |
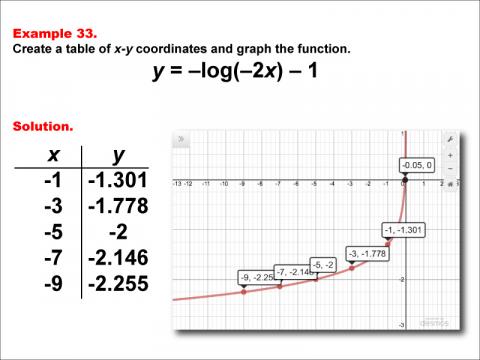
Math Example: Logarithmic Functions in Tabular and Graph Form: Example 33 |
|
Math Example: Logarithmic Functions in Tabular and Graph Form: Example 33
This is part of a collection of math examples that focus on logarithmic functions in tabular and graphic form. |
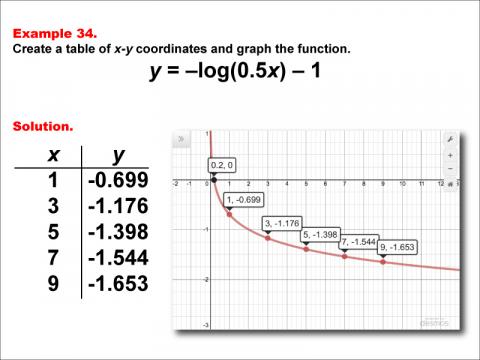
Math Example: Logarithmic Functions in Tabular and Graph Form: Example 34 |
|
Math Example: Logarithmic Functions in Tabular and Graph Form: Example 34
This is part of a collection of math examples that focus on logarithmic functions in tabular and graphic form. |
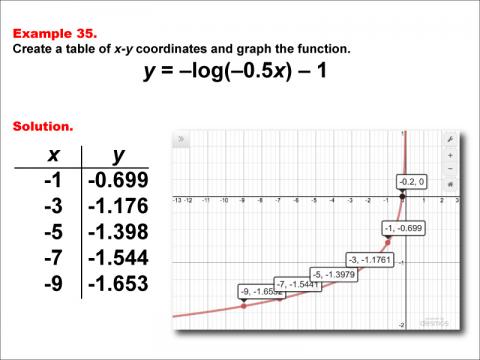
Math Example: Logarithmic Functions in Tabular and Graph Form: Example 35 |
|
Math Example: Logarithmic Functions in Tabular and Graph Form: Example 35
This is part of a collection of math examples that focus on logarithmic functions in tabular and graphic form. |
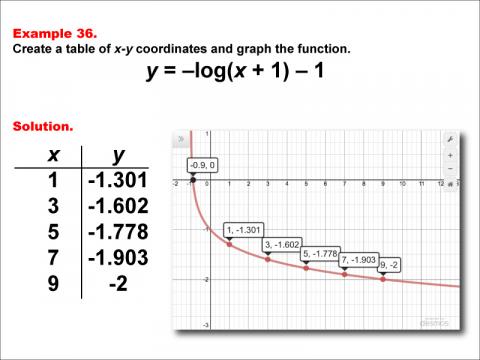
Math Example: Logarithmic Functions in Tabular and Graph Form: Example 36 |
|
Math Example: Logarithmic Functions in Tabular and Graph Form: Example 36
This is part of a collection of math examples that focus on logarithmic functions in tabular and graphic form. |
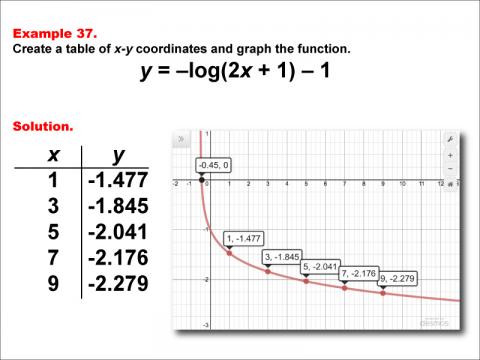
Math Example: Logarithmic Functions in Tabular and Graph Form: Example 37 |
|
Math Example: Logarithmic Functions in Tabular and Graph Form: Example 37
This is part of a collection of math examples that focus on logarithmic functions in tabular and graphic form. |
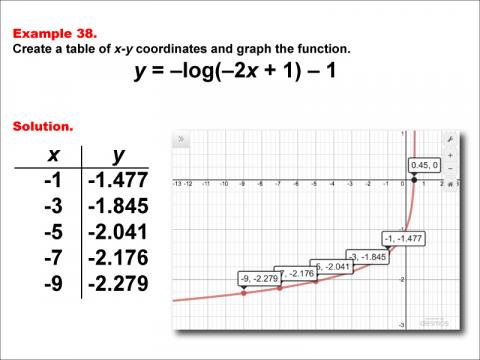
Math Example: Logarithmic Functions in Tabular and Graph Form: Example 38 |
|
Math Example: Logarithmic Functions in Tabular and Graph Form: Example 38
This is part of a collection of math examples that focus on logarithmic functions in tabular and graphic form. |
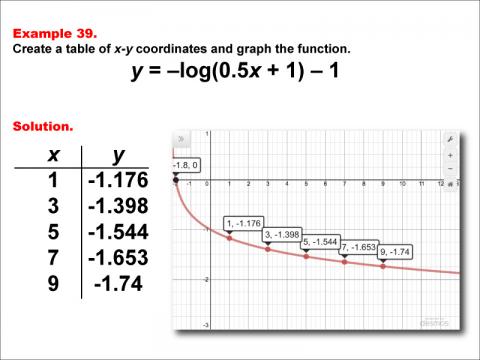
Math Example: Logarithmic Functions in Tabular and Graph Form: Example 39 |
|
Math Example: Logarithmic Functions in Tabular and Graph Form: Example 39
This is part of a collection of math examples that focus on logarithmic functions in tabular and graphic form. |
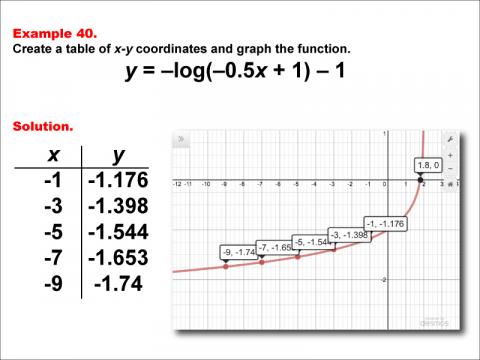
Math Example: Logarithmic Functions in Tabular and Graph Form: Example 40 |
|
Math Example: Logarithmic Functions in Tabular and Graph Form: Example 40
This is part of a collection of math examples that focus on logarithmic functions in tabular and graphic form. |
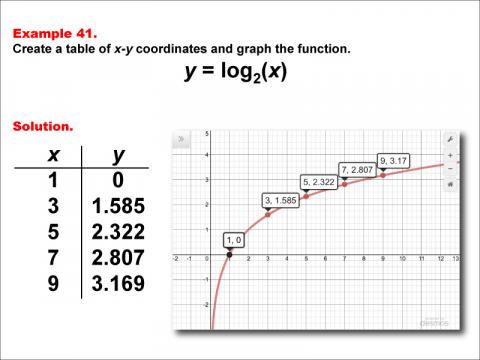
Math Example: Logarithmic Functions in Tabular and Graph Form: Example 41 |
|
Math Example: Logarithmic Functions in Tabular and Graph Form: Example 41
This is part of a collection of math examples that focus on logarithmic functions in tabular and graphic form. |
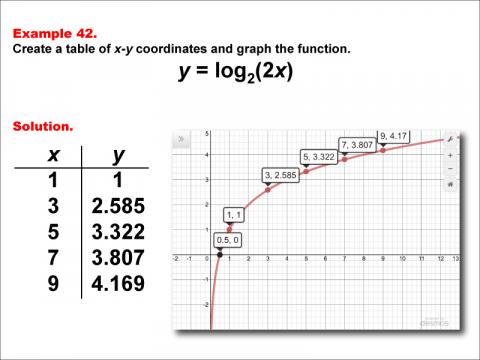
Math Example: Logarithmic Functions in Tabular and Graph Form: Example 42 |
|
Math Example: Logarithmic Functions in Tabular and Graph Form: Example 42
This is part of a collection of math examples that focus on logarithmic functions in tabular and graphic form. |
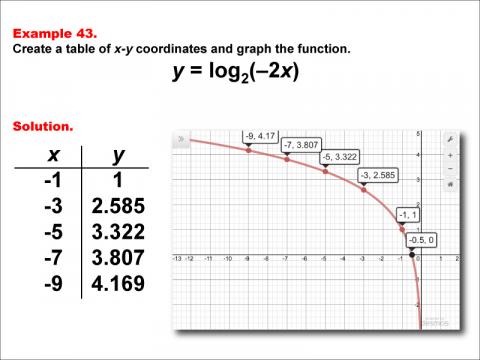
Math Example: Logarithmic Functions in Tabular and Graph Form: Example 43 |
|
Math Example: Logarithmic Functions in Tabular and Graph Form: Example 43
This is part of a collection of math examples that focus on logarithmic functions in tabular and graphic form. |
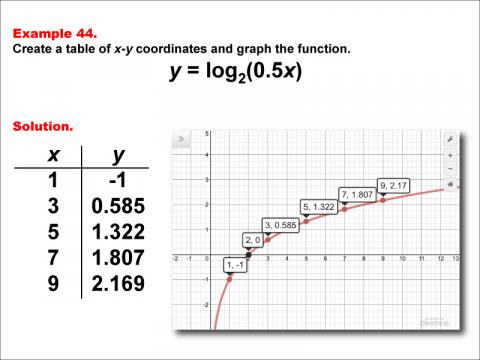
Math Example: Logarithmic Functions in Tabular and Graph Form: Example 44 |
|
Math Example: Logarithmic Functions in Tabular and Graph Form: Example 44
This is part of a collection of math examples that focus on logarithmic functions in tabular and graphic form. |
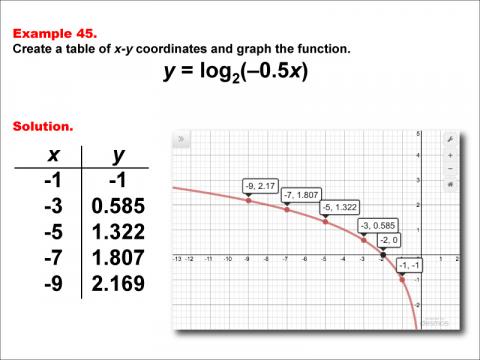
Math Example: Logarithmic Functions in Tabular and Graph Form: Example 45 |
|
Math Example: Logarithmic Functions in Tabular and Graph Form: Example 45
This is part of a collection of math examples that focus on logarithmic functions in tabular and graphic form. |
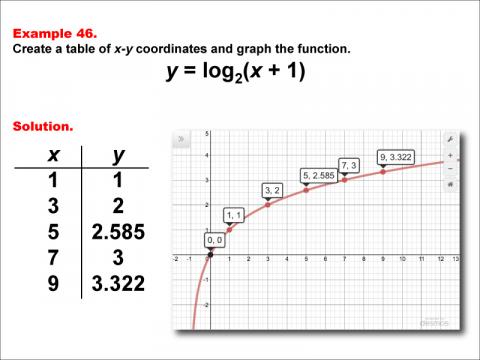
Math Example: Logarithmic Functions in Tabular and Graph Form: Example 46 |
|
Math Example: Logarithmic Functions in Tabular and Graph Form: Example 46
This is part of a collection of math examples that focus on logarithmic functions in tabular and graphic form. |