Digital Resources on the Topic of Exponential and Logarithmic Functions
|
|
| Thumbnail Image | Description | |
|---|---|---|
Math Example: Logarithmic Functions in Tabular and Graph Form: Example 107 |
|
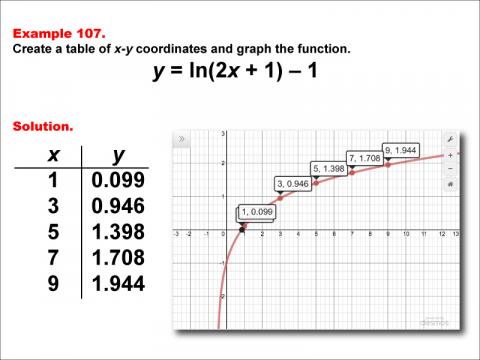
Math Example: Logarithmic Functions in Tabular and Graph Form: Example 107
This is part of a collection of math examples that focus on logarithmic functions in tabular and graphic form. |
Math Example: Logarithmic Functions in Tabular and Graph Form: Example 108 |
|
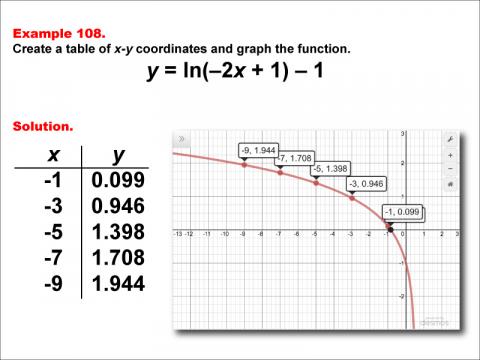
Math Example: Logarithmic Functions in Tabular and Graph Form: Example 108
This is part of a collection of math examples that focus on logarithmic functions in tabular and graphic form. |
Math Example: Logarithmic Functions in Tabular and Graph Form: Example 109 |
|
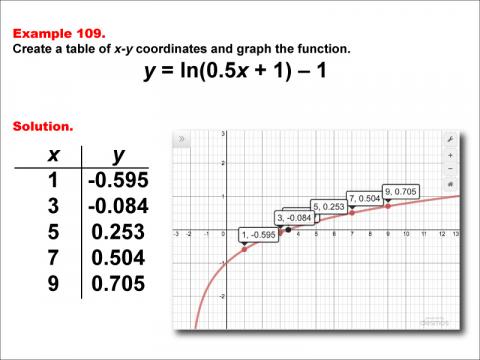
Math Example: Logarithmic Functions in Tabular and Graph Form: Example 109
This is part of a collection of math examples that focus on logarithmic functions in tabular and graphic form. |
Math Example: Logarithmic Functions in Tabular and Graph Form: Example 11 |
|
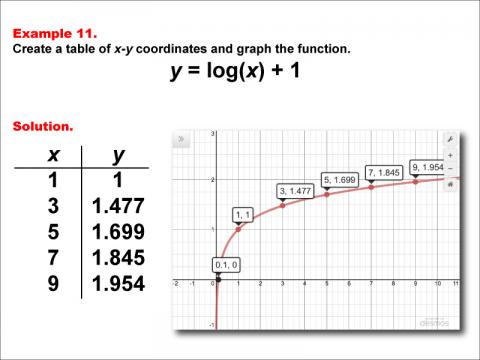
Math Example: Logarithmic Functions in Tabular and Graph Form: Example 11
This is part of a collection of math examples that focus on logarithmic functions in tabular and graphic form. |
Math Example: Logarithmic Functions in Tabular and Graph Form: Example 110 |

|
Math Example: Logarithmic Functions in Tabular and Graph Form: Example 110
This is part of a collection of math examples that focus on logarithmic functions in tabular and graphic form. |
Math Example: Logarithmic Functions in Tabular and Graph Form: Example 111 |
|
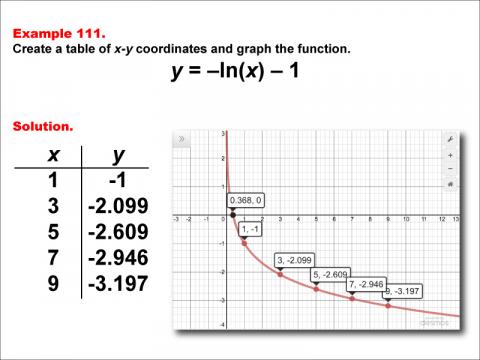
Math Example: Logarithmic Functions in Tabular and Graph Form: Example 111
This is part of a collection of math examples that focus on logarithmic functions in tabular and graphic form. |
Math Example: Logarithmic Functions in Tabular and Graph Form: Example 112 |
|
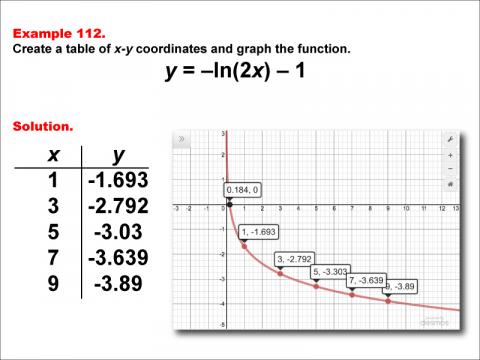
Math Example: Logarithmic Functions in Tabular and Graph Form: Example 112
This is part of a collection of math examples that focus on logarithmic functions in tabular and graphic form. |
Math Example: Logarithmic Functions in Tabular and Graph Form: Example 113 |
|
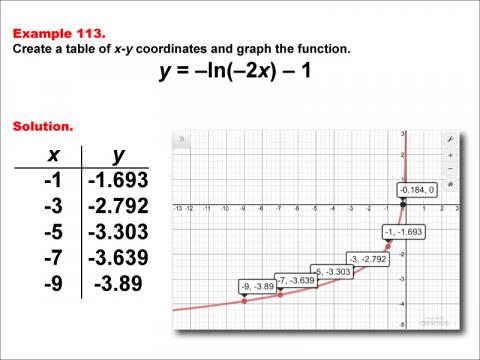
Math Example: Logarithmic Functions in Tabular and Graph Form: Example 113
This is part of a collection of math examples that focus on logarithmic functions in tabular and graphic form. |
Math Example: Logarithmic Functions in Tabular and Graph Form: Example 114 |
|
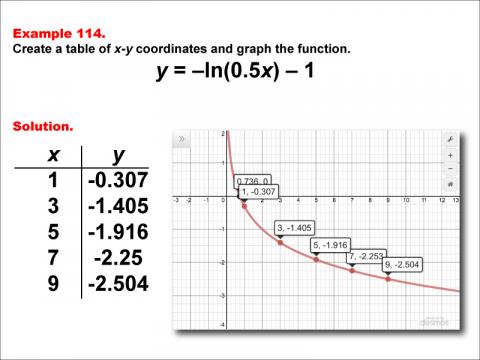
Math Example: Logarithmic Functions in Tabular and Graph Form: Example 114
This is part of a collection of math examples that focus on logarithmic functions in tabular and graphic form. |
Math Example: Logarithmic Functions in Tabular and Graph Form: Example 115 |
|
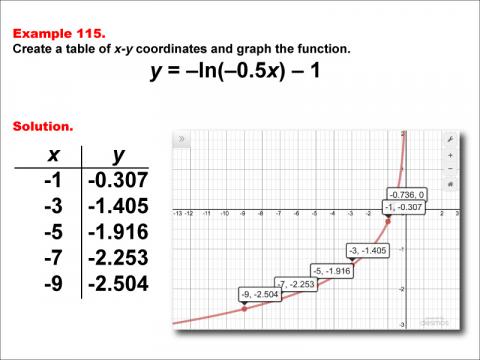
Math Example: Logarithmic Functions in Tabular and Graph Form: Example 115
This is part of a collection of math examples that focus on logarithmic functions in tabular and graphic form. |
Math Example: Logarithmic Functions in Tabular and Graph Form: Example 116 |
|
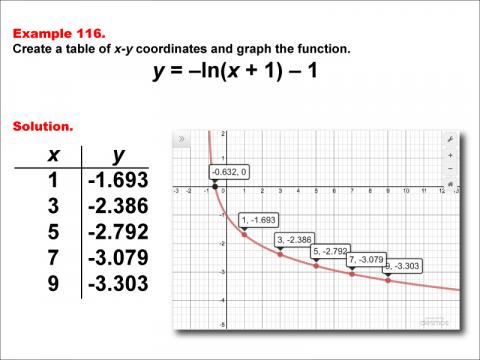
Math Example: Logarithmic Functions in Tabular and Graph Form: Example 116
This is part of a collection of math examples that focus on logarithmic functions in tabular and graphic form. |
Math Example: Logarithmic Functions in Tabular and Graph Form: Example 117 |
|
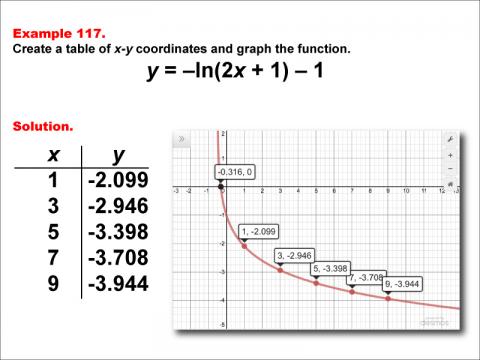
Math Example: Logarithmic Functions in Tabular and Graph Form: Example 117
This is part of a collection of math examples that focus on logarithmic functions in tabular and graphic form. |
Math Example: Logarithmic Functions in Tabular and Graph Form: Example 118 |
|
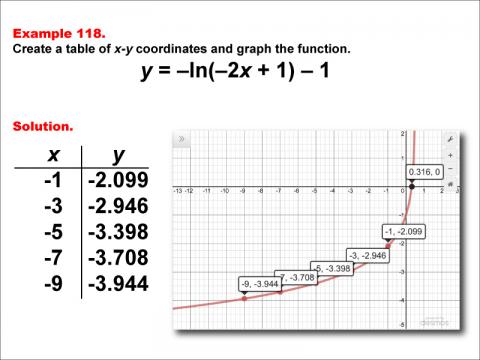
Math Example: Logarithmic Functions in Tabular and Graph Form: Example 118
This is part of a collection of math examples that focus on logarithmic functions in tabular and graphic form. |
Math Example: Logarithmic Functions in Tabular and Graph Form: Example 119 |
|
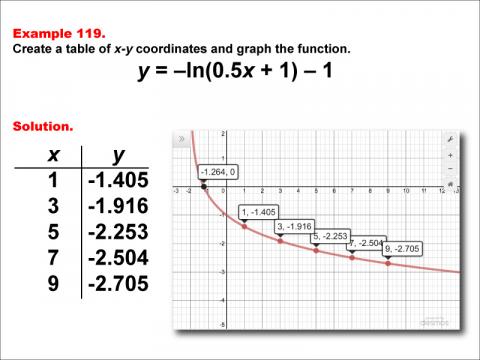
Math Example: Logarithmic Functions in Tabular and Graph Form: Example 119
This is part of a collection of math examples that focus on logarithmic functions in tabular and graphic form. |
Math Example: Logarithmic Functions in Tabular and Graph Form: Example 12 |
|
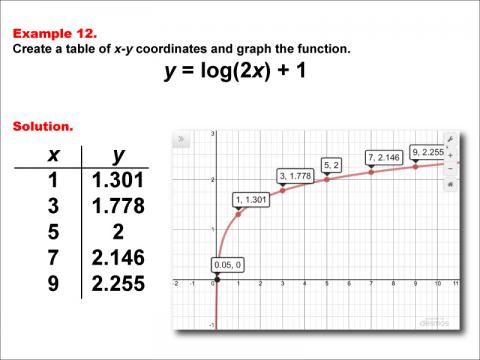
Math Example: Logarithmic Functions in Tabular and Graph Form: Example 12
This is part of a collection of math examples that focus on logarithmic functions in tabular and graphic form. |
Math Example: Logarithmic Functions in Tabular and Graph Form: Example 120 |
|
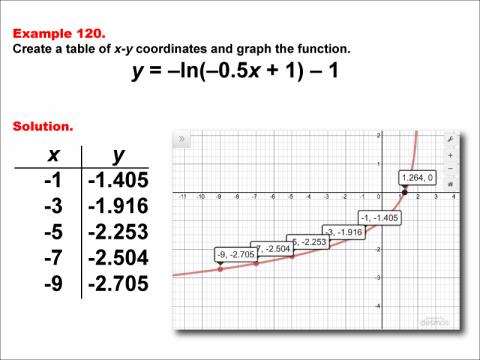
Math Example: Logarithmic Functions in Tabular and Graph Form: Example 120
This is part of a collection of math examples that focus on logarithmic functions in tabular and graphic form. |
Math Example: Logarithmic Functions in Tabular and Graph Form: Example 13 |
|
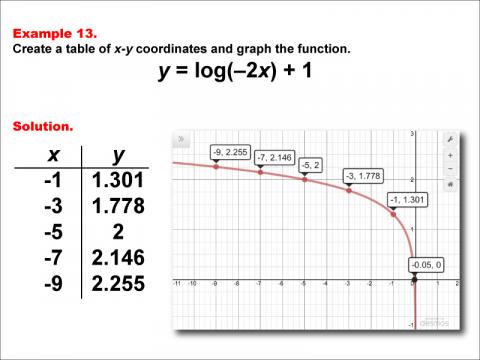
Math Example: Logarithmic Functions in Tabular and Graph Form: Example 13
This is part of a collection of math examples that focus on logarithmic functions in tabular and graphic form. |
Math Example: Logarithmic Functions in Tabular and Graph Form: Example 14 |
|
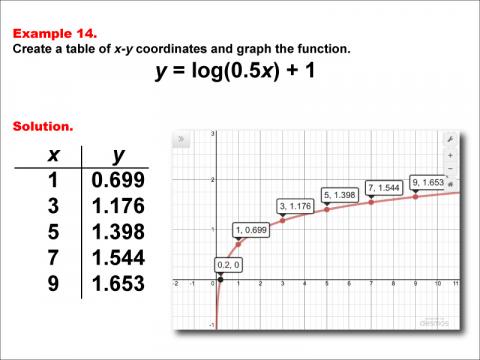
Math Example: Logarithmic Functions in Tabular and Graph Form: Example 14
This is part of a collection of math examples that focus on logarithmic functions in tabular and graphic form. |
Math Example: Logarithmic Functions in Tabular and Graph Form: Example 15 |
|
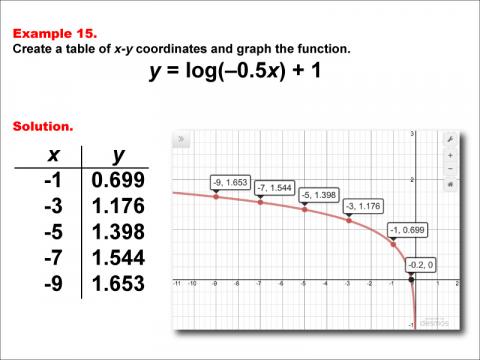
Math Example: Logarithmic Functions in Tabular and Graph Form: Example 15
This is part of a collection of math examples that focus on logarithmic functions in tabular and graphic form. |
Math Example: Logarithmic Functions in Tabular and Graph Form: Example 16 |
|
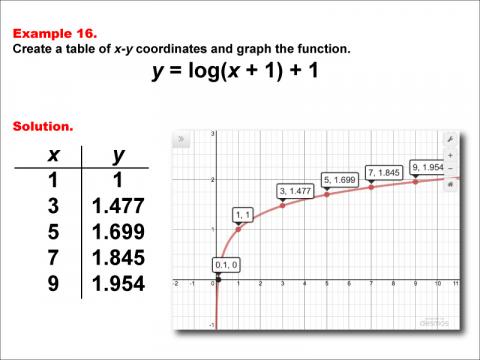
Math Example: Logarithmic Functions in Tabular and Graph Form: Example 16
This is part of a collection of math examples that focus on logarithmic functions in tabular and graphic form. |
Math Example: Logarithmic Functions in Tabular and Graph Form: Example 17 |
|
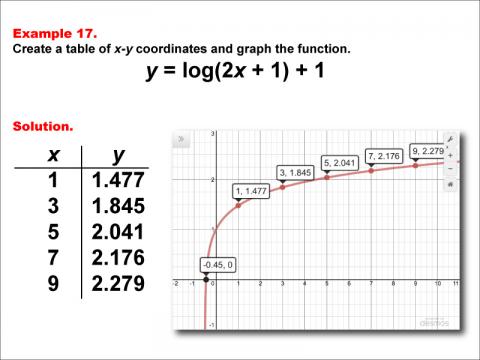
Math Example: Logarithmic Functions in Tabular and Graph Form: Example 17
This is part of a collection of math examples that focus on logarithmic functions in tabular and graphic form. |
Math Example: Logarithmic Functions in Tabular and Graph Form: Example 18 |
|
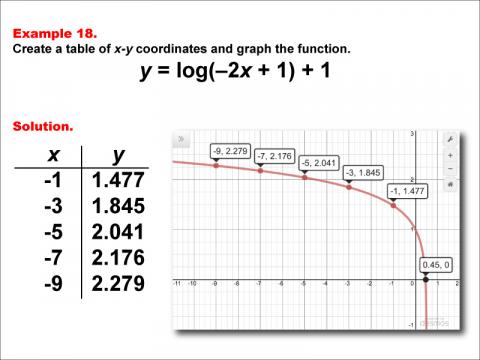
Math Example: Logarithmic Functions in Tabular and Graph Form: Example 18
This is part of a collection of math examples that focus on logarithmic functions in tabular and graphic form. |
Math Example: Logarithmic Functions in Tabular and Graph Form: Example 19 |
|
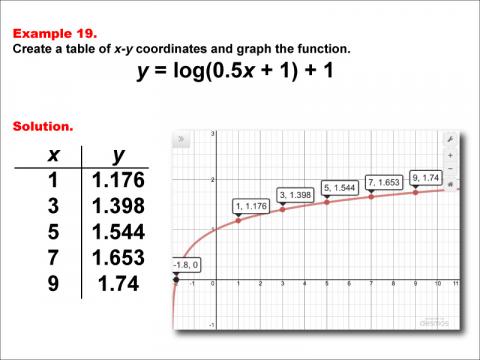
Math Example: Logarithmic Functions in Tabular and Graph Form: Example 19
This is part of a collection of math examples that focus on logarithmic functions in tabular and graphic form. |
Math Example: Logarithmic Functions in Tabular and Graph Form: Example 20 |
|
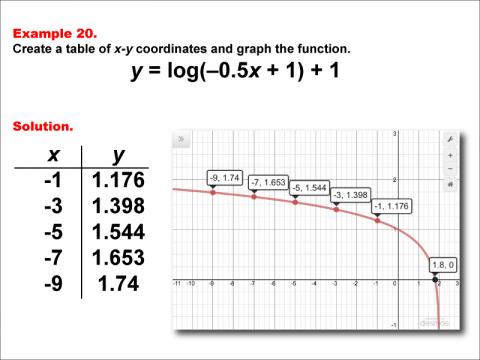
Math Example: Logarithmic Functions in Tabular and Graph Form: Example 20
This is part of a collection of math examples that focus on logarithmic functions in tabular and graphic form. |
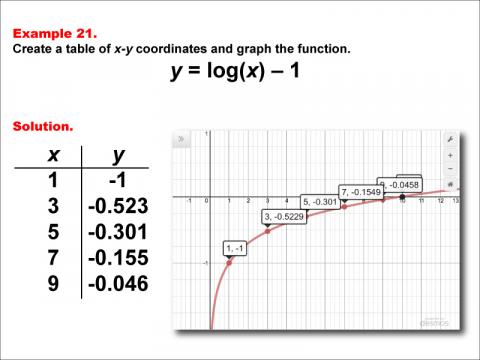
Math Example: Logarithmic Functions in Tabular and Graph Form: Example 21 |
|
Math Example: Logarithmic Functions in Tabular and Graph Form: Example 21
This is part of a collection of math examples that focus on logarithmic functions in tabular and graphic form. |