These are the resources that support this NYS Standard.
NY-AII-S.IC.6b: Use the language of statistics to critique claims from informational texts. For example, causation vs correlation, bias, measures of center and spread.
There are 29 resources.| Title | Description | Thumbnail Image | Curriculum Topics |
|---|---|---|---|
Math in the News Collection: Business Math |
OverviewThis is a collection of issues of Math in the News that deal with business applications. | 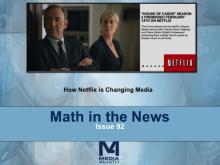
|
Applications of Exponential and Logarithmic Functions, Data Analysis and Volume |
Math in the News Collection: Applications of Data Analysis |
This is a collection of Math in the News stories that focus on the topic of Data Analysis. | 
|
Data Analysis, Data Gathering, Probability, Percents and Ratios and Rates |
Math in the News Collection: Applications of Exponential Functions |
OverThis is a collection of Math in the News stories that focus on the topic of Exponential Functions. | 
|
Applications of Exponential and Logarithmic Functions, Applications of Linear Functions, Data Analysis and Sequences |
Math Clip Art Collection: Two-Way Frequency Tables |
This collection aggregates all the math clip art around the topic of Two-Way Frequency Tables. There are a total of 6 images. | 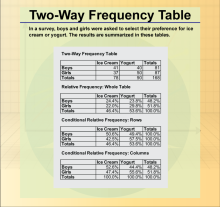
|
Data Analysis |
Math Clip Art Collection: Statistics |
Overview This colleThis collection aggregates all the math clip art around the topic of Statistics. There are a total of 55 images. | 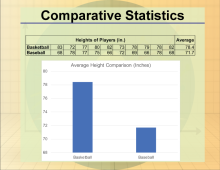
|
Data Analysis, Probability, Data Gathering and Counting |
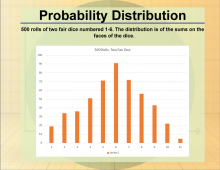
Math Clip Art Collection: Probability Distributions |
This collection aggregates all the math clip art around the topic of Probability Distributions. There are a total of 12 images. | 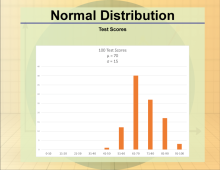
|
Probability |
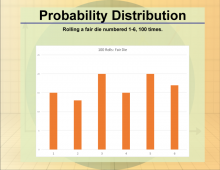
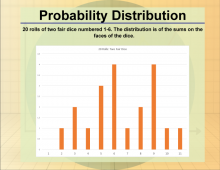
Math Clip Art--Statistics and Probability--Probability Distribution--1 |
Math Clip Art--Statistics and Probability--Probability Distribution--1
This is part of a collection of math clip art images that show different statistical graphs and concepts, along with some probability concepts. |
|
Probability |
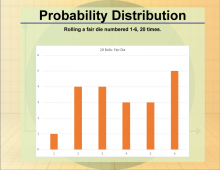
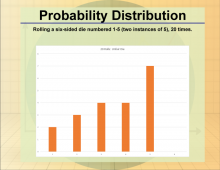
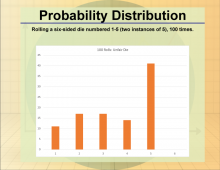
Math Clip Art--Statistics and Probability--Probability Distribution--10 |
Math Clip Art--Statistics and Probability--Probability Distribution--10
This is part of a collection of math clip art images that show different statistical graphs and concepts, along with some probability concepts. |
|
Probability |
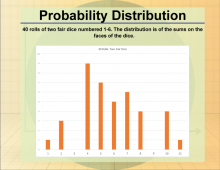
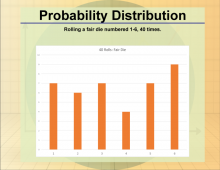
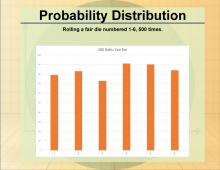
Math Clip Art--Statistics and Probability--Probability Distribution--11 |
Math Clip Art--Statistics and Probability--Probability Distribution--11
This is part of a collection of math clip art images that show different statistical graphs and concepts, along with some probability concepts. |
|
Probability |
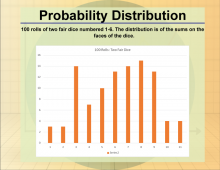
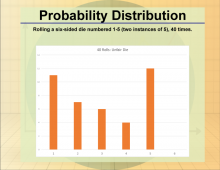
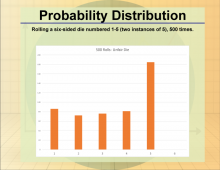
Math Clip Art--Statistics and Probability--Probability Distribution--12 |
Math Clip Art--Statistics and Probability--Probability Distribution--12
This is part of a collection of math clip art images that show different statistical graphs and concepts, along with some probability concepts. |
|
Probability |
Math Clip Art--Statistics and Probability--Probability Distribution--2 |
Math Clip Art--Statistics and Probability--Probability Distribution--2
This is part of a collection of math clip art images that show different statistical graphs and concepts, along with some probability concepts. |
|
Probability |
Math Clip Art--Statistics and Probability--Probability Distribution--3 |
Math Clip Art--Statistics and Probability--Probability Distribution--3
This is part of a collection of math clip art images that show different statistical graphs and concepts, along with some probability concepts. |
|
Probability |
Math Clip Art--Statistics and Probability--Probability Distribution--4 |
Math Clip Art--Statistics and Probability--Probability Distribution--4
This is part of a collection of math clip art images that show different statistical graphs and concepts, along with some probability concepts. |
|
Probability |
Math Clip Art--Statistics and Probability--Probability Distribution--5 |
Math Clip Art--Statistics and Probability--Probability Distribution--5
This is part of a collection of math clip art images that show different statistical graphs and concepts, along with some probability concepts. |
|
Probability |
Math Clip Art--Statistics and Probability--Probability Distribution--6 |
Math Clip Art--Statistics and Probability--Probability Distribution--6
This is part of a collection of math clip art images that show different statistical graphs and concepts, along with some probability concepts. |
|
Probability |
Math Clip Art--Statistics and Probability--Probability Distribution--7 |
Math Clip Art--Statistics and Probability--Probability Distribution--7
This is part of a collection of math clip art images that show different statistical graphs and concepts, along with some probability concepts. |
|
Probability |
Math Clip Art--Statistics and Probability--Probability Distribution--8 |
Math Clip Art--Statistics and Probability--Probability Distribution--8
This is part of a collection of math clip art images that show different statistical graphs and concepts, along with some probability concepts. |
|
Probability |
Math Clip Art--Statistics and Probability--Probability Distribution--9 |
Math Clip Art--Statistics and Probability--Probability Distribution--9
This is part of a collection of math clip art images that show different statistical graphs and concepts, along with some probability concepts. |
|
Probability |
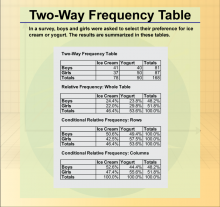
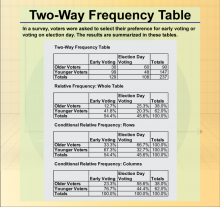
Math Clip Art--Statistics and Probability--Two-Way Frequency Table--1 |
Math Clip Art--Statistics and Probability--Two-Way Frequency Table--1
This is part of a collection of math clip art images that show different statistical graphs and concepts, along with some probability concepts. |
|
Data Analysis |
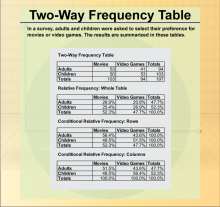
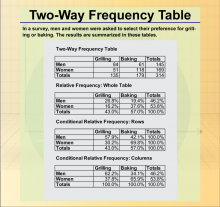
Math Clip Art--Statistics and Probability--Two-Way Frequency Table--2 |
Math Clip Art--Statistics and Probability--Two-Way Frequency Table--2
This is part of a collection of math clip art images that show different statistical graphs and concepts, along with some probability concepts. |
|
Data Analysis |
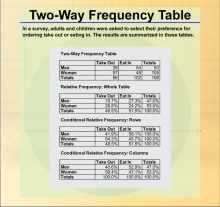
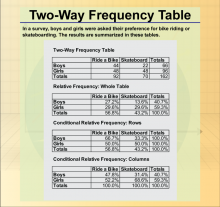
Math Clip Art--Statistics and Probability--Two-Way Frequency Table--3 |
Math Clip Art--Statistics and Probability--Two-Way Frequency Table--3
This is part of a collection of math clip art images that show different statistical graphs and concepts, along with some probability concepts. |
|
Data Analysis |
Math Clip Art--Statistics and Probability--Two-Way Frequency Table--4 |
Math Clip Art--Statistics and Probability--Two-Way Frequency Table--4
This is part of a collection of math clip art images that show different statistical graphs and concepts, along with some probability concepts. |
|
Data Analysis |
Math Clip Art--Statistics and Probability--Two-Way Frequency Table--5 |
Math Clip Art--Statistics and Probability--Two-Way Frequency Table--5
This is part of a collection of math clip art images that show different statistical graphs and concepts, along with some probability concepts. |
|
Data Analysis |
Math Clip Art--Statistics and Probability--Two-Way Frequency Table--6 |
Math Clip Art--Statistics and Probability--Two-Way Frequency Table--6
This is part of a collection of math clip art images that show different statistical graphs and concepts, along with some probability concepts. |
|
Data Analysis |
Math in the News: Issue 104--The Decline of Radio Shack |
Math in the News: Issue 104--The Decline of Radio Shack
December 2014. In this issue of Math in the News we analyze the reasons why Radio Shack has struggled as a business. |
|
Data Analysis |
Join the hundreds of thousands of math educators who have used Media4Math resources in their classroom to engage their students. Our new integrated Library/Classroom product has everything you need!
About Media4Math
Our Mission
Media4Math's mission is to educate 21st-century students in real-world applications of math with digital technology. We bring math to life in your classroom with a rich blend of resources to inspire your students to learn. Our philosophy is that the procedural side of math is a prerequisite to using it, but we also find that real-world math applications can provide motivation and even inspiration for math students. Math is its own language and it has important stories to tell. While many of our resources are for procedural skills, there are many resources that are real-world applications of math. Some of these resources rely on partnerships with other educational publishers.
About Media4Math Library
Media4Math Library contains over 15,000 high-quality resources designed for classroom or home use. This includes instructional, remediation, and assessment resources. You'll find truly innovative resources that bring math to life. Resources in Media4Math Library include:
- Videos
- Math Clip Art
- Math Examples
- Quizzes
- Tutorials
- PowerPoint and Google Slide presentations
- GoogleEarth Voyager Stories
- Algebra Applications
- Geometry Explorations
- Quizlet Flash Cards
- Desmos Resources
- Texas Instrument Resources
- Games and Simulations
About Media4Math Classroom
Media4Math Classroom provides ready-to-use interactive math lessons that teach, assess, and provide real-world applications of topics in Pre-Algebra, Algebra, and Geometry. Assign these modules to your students and capture assessment scores in an easy-to-use Dashboard. This is a growing library of instructional modules. Topics include:
- Arithmetic
- Pre-Algebra
- Algebra
- Geometry
- SAT Math Prep
Media4Math Classroom modules provide real world applications of math that will motivate your students. Here are some examples:
- Construction Site Math. Apply ratios and proportions to mixtures of cement and concrete. This module includes video resources and your students will get a real-world application of ratios and proportions.
- Counting Bison. Apply place value concepts to the real-world application of the bison population. Because the bison population has gone through dramatic changes in population, this become an opportunity to use and apply place value.
- Wildlife Refuge. This study of area and perimeter centers on the mustang population in the Nevada area. Students explore the relationship between area and perimeter of rectangular shapes in the context of designing a wildlife refuge.
The Media4Math Bundle
A subscription to the Media4Math bundle gives teachers access to all the resources listed above. Specifically:
- Access to all the Media4Math Library resources and tools.
- Access to all the Media4Math Classroom instructional modules.
To learn more about our subscription packages, contact us at admin@media4math.com.
Partnering with Media4Math
Media4Math prides itself on its strategic partnerships with other educational organizations. Our partnerships include the following partners:
-
Google Earth. Media4Math has partnered with GoogleEarth to create a comprehensive library of GoogleEarth Voyager Stories. These map-based explorations of geometry, geography, and culture will literally bring the math to life. See our collection of Voyager Stories by clicking on this link to the Google Earth resources.
-
Texas Instruments. TI is the leading provider of graphing calculators used in the classroom. Media4Math has partnered with TI to create a library of digital resources to support the use of these graphing calculators. These resources include videos, presentations, and related tutorials. See our collection of TI resources by clicking on this link to the TI resources.
-
Desmos. This free online resource that includes a graphing calculator and geometry tools. Media4Math has created an extensive library of resources that support the use of these Desmos resources. See our collection of Desmos resources by clicking on this link to the Desmos resources.
- Quizlet. We have partnered with the leading provider of interactive Flash Cards and is used by millions of teachers and students around the world. Media4Math has developed an extensive library of Quizlet resources. See our collection of Quizlet resources by clicking on this link to the Quizlet resources.
Link to the Media4Math Study Sets on Quizlet and search for "Media4Math."
- The Princeton Review. The Princeton Review is the leading provider of SAT prep and other test preparation courses and tutorials. Media4Math is an affiliate of Princeton Review and we have created a set of free SAT math resources, sponsored by Princeton Review. See this collection of SAT resources by clicking on this link to the Princeton Review resources.
If you would like to partner with Media4Math, please reach out to us at admin@media4math.com.