
These are the resources that support this NYS Standard.
NY-AI-S.ID.5: Summarize categorical data for two categories in two-way frequency tables. Interpret relative frequencies in the context of the data (including joint, marginal, and conditional relative frequencies). Recognize possible associations and trends in the data.
There are 14 resources.| Title | Description | Thumbnail Image | Curriculum Topics |
|---|---|---|---|
Math Clip Art Collection: Statistics |
Overview This colleThis collection aggregates all the math clip art around the topic of Statistics. There are a total of 55 images. | 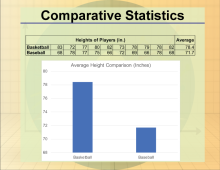
|
Data Analysis, Probability, Data Gathering and Counting |
Math Clip Art Collection: Two-Way Frequency Tables |
This collection aggregates all the math clip art around the topic of Two-Way Frequency Tables. There are a total of 6 images. | 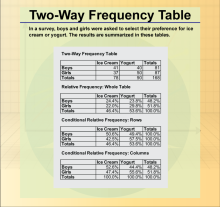
|
Data Analysis |
Math Definitions Collection: Statistics and Probability |
This collection aggregates all the definition image cards around the topic of Statistics and Probability terms and vocabulary. There are a total of 34 terms. | 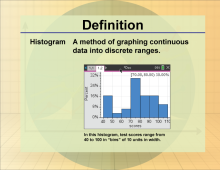
|
Data Analysis, Probability and Data Gathering |
Definition--Statistics and Probability Concepts--Conditional Relative Frequency |
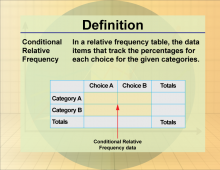
Definition--Statistics and Probability Concepts--Conditional Relative Frequency
This is part of a collection of definitions on the topic of probability and statistics. Each definition includes an example of the term. |
|
Data Analysis |
Definition--Statistics and Probability Concepts--Joint Frequencies |
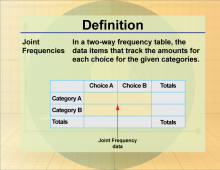
Definition--Statistics and Probability Concepts--Joint Frequencies
This is part of a collection of definitions on the topic of probability and statistics. Each definition includes an example of the term. |
|
Data Analysis |
Definition--Statistics and Probability Concepts--Marginal Frequencies |
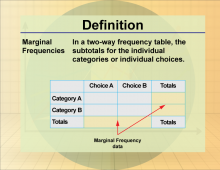
Definition--Statistics and Probability Concepts--Marginal Frequencies
This is part of a collection of definitions on the topic of probability and statistics. Each definition includes an example of the term. |
|
Data Analysis |
Definition--Statistics and Probability Concepts--Relative Frequency Table |
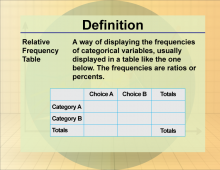
Definition--Statistics and Probability Concepts--Relative Frequency Table
This is part of a collection of definitions on the topic of probability and statistics. Each definition includes an example of the term. |
|
Data Analysis |
Definition--Statistics and Probability Concepts--Two-Way Frequency Table |
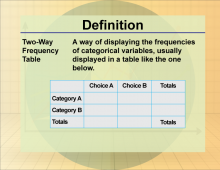
Definition--Statistics and Probability Concepts--Two-Way Frequency Table
This is part of a collection of definitions on the topic of probability and statistics. Each definition includes an example of the term. |
|
Data Analysis |
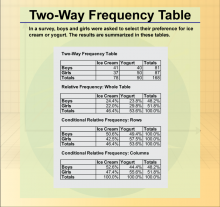
Math Clip Art--Statistics and Probability--Two-Way Frequency Table--1 |
Math Clip Art--Statistics and Probability--Two-Way Frequency Table--1
This is part of a collection of math clip art images that show different statistical graphs and concepts, along with some probability concepts. |
|
Data Analysis |
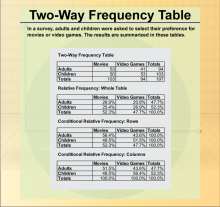
Math Clip Art--Statistics and Probability--Two-Way Frequency Table--2 |
Math Clip Art--Statistics and Probability--Two-Way Frequency Table--2
This is part of a collection of math clip art images that show different statistical graphs and concepts, along with some probability concepts. |
|
Data Analysis |
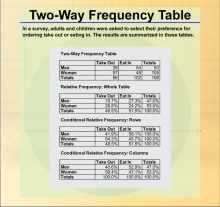
Math Clip Art--Statistics and Probability--Two-Way Frequency Table--3 |
Math Clip Art--Statistics and Probability--Two-Way Frequency Table--3
This is part of a collection of math clip art images that show different statistical graphs and concepts, along with some probability concepts. |
|
Data Analysis |
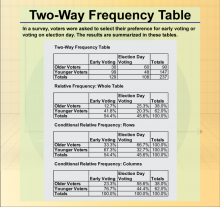
Math Clip Art--Statistics and Probability--Two-Way Frequency Table--4 |
Math Clip Art--Statistics and Probability--Two-Way Frequency Table--4
This is part of a collection of math clip art images that show different statistical graphs and concepts, along with some probability concepts. |
|
Data Analysis |
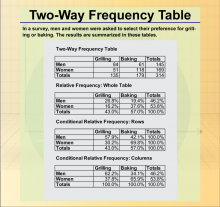
Math Clip Art--Statistics and Probability--Two-Way Frequency Table--5 |
Math Clip Art--Statistics and Probability--Two-Way Frequency Table--5
This is part of a collection of math clip art images that show different statistical graphs and concepts, along with some probability concepts. |
|
Data Analysis |
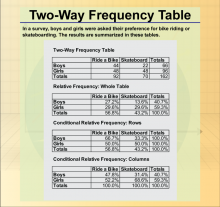
Math Clip Art--Statistics and Probability--Two-Way Frequency Table--6 |
Math Clip Art--Statistics and Probability--Two-Way Frequency Table--6
This is part of a collection of math clip art images that show different statistical graphs and concepts, along with some probability concepts. |
|
Data Analysis |

