These are the resources that support this Florida Standard.
MAFS.7.SP.2.4: Use measures of center and measures of variability for numerical data from random samples to draw informal comparative inferences about two populations. For example, decide whether the words in a chapter of a seventh-grade science book are generally longer than the words in a chapter of a fourth-grade science book.
There are 129 resources.| Title | Description | Thumbnail Image | Curriculum Topics |
|---|---|---|---|
Math in the News Collection: Applications of Data Analysis |

|
Data Analysis, Data Gathering, Probability, Percents and Ratios and Rates | |
Quizlet Flash Card Collection: Measures of Central Tendency |

|
Data Analysis | |
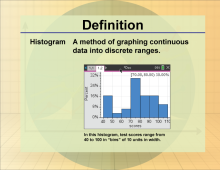
Math Definitions Collection: Statistics and Probability |
|
Data Analysis, Probability and Data Gathering | |
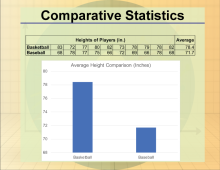
Math Clip Art Collection: Statistics |
Overview This colle |
|
Data Analysis, Probability, Data Gathering and Counting |
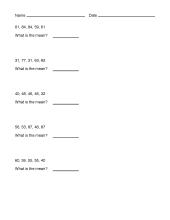
Math Worksheet Collection: Data Analysis: Mean, Median, and Mode |
Math Worksheet Collection: Data Analysis: Mean, Median, and Mode |
|
Data Analysis |
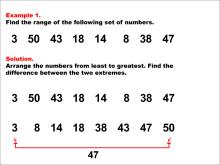
Math Examples Collection: Range |
Overview |
|
Data Analysis |
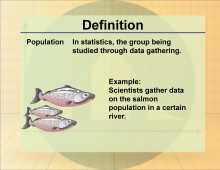
Definition--Statistics and Probability Concepts--Population |
Definition--Statistics and Probability Concepts--PopulationThis is part of a collection of definitions on the topic of probability and statistics. Each definition includes an example of the term. |
|
Data Gathering |
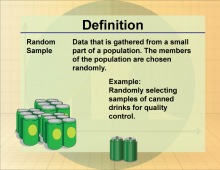
Definition--Statistics and Probability Concepts--Random Sample |
Definition--Statistics and Probability Concepts--Random SampleThis is part of a collection of definitions on the topic of probability and statistics. Each definition includes an example of the term. |
|
Data Gathering |
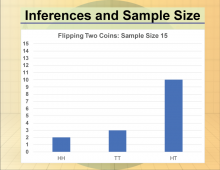
Math Clip Art--Statistics and Probability-- Inferences and Sample Size--10 |
Math Clip Art--Statistics and Probability-- Inferences and Sample Size--10This is part of a collection of math clip art images that show different statistical graphs and concepts, along with some probability concepts. |
|
Data Gathering |
Math Clip Art--Statistics and Probability-- Inferences and Sample Size--11 |
Math Clip Art--Statistics and Probability-- Inferences and Sample Size--11This is part of a collection of math clip art images that show different statistical graphs and concepts, along with some probability concepts. |
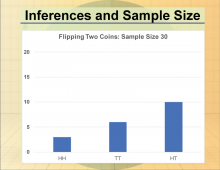
|
Data Gathering |
Math Clip Art--Statistics and Probability-- Inferences and Sample Size--12 |
Math Clip Art--Statistics and Probability-- Inferences and Sample Size--12This is part of a collection of math clip art images that show different statistical graphs and concepts, along with some probability concepts. |
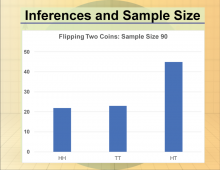
|
Data Gathering |
Math Clip Art--Statistics and Probability-- Inferences and Sample Size--9 |
Math Clip Art--Statistics and Probability-- Inferences and Sample Size--9This is part of a collection of math clip art images that show different statistical graphs and concepts, along with some probability concepts. |
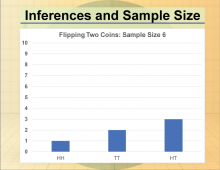
|
Data Gathering |
Math Clip Art--Statistics--Comparative Statistic--02 |
Math Clip Art--Statistics--Comparative Statistic--02This is part of a collection of math clip art images that show different statistical graphs and concepts, along with some probability concepts. |
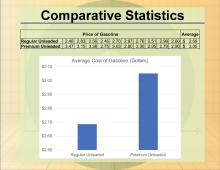
|
Data Analysis |
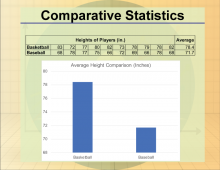
Math Clip Art--Statistics--Comparative Statistics--01 |
Math Clip Art--Statistics--Comparative Statistics--01This is part of a collection of math clip art images that show different statistical graphs and concepts, along with some probability concepts. |
|
Data Analysis |
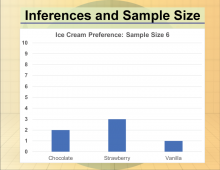
Math Clip Art--Statistics--Inferences and Sample Size--01 |
Math Clip Art--Statistics--Inferences and Sample Size--01This is part of a collection of math clip art images that show different statistical graphs and concepts, along with some probability concepts. |
|
Data Gathering |
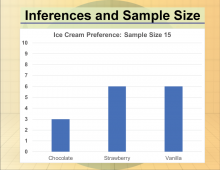
Math Clip Art--Statistics--Inferences and Sample Size--02 |
Math Clip Art--Statistics--Inferences and Sample Size--02This is part of a collection of math clip art images that show different statistical graphs and concepts, along with some probability concepts. |
|
Data Gathering |
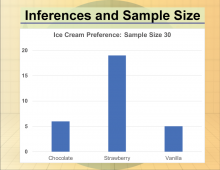
Math Clip Art--Statistics--Inferences and Sample Size--03 |
Math Clip Art--Statistics--Inferences and Sample Size--03This is part of a collection of math clip art images that show different statistical graphs and concepts, along with some probability concepts. |
|
Data Gathering |
Math Clip Art--Statistics--Inferences and Sample Size--04 |
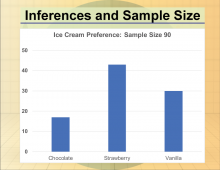
Math Clip Art--Statistics--Inferences and Sample Size--04This is part of a collection of math clip art images that show different statistical graphs and concepts, along with some probability concepts. |
|
Data Gathering |
Math Clip Art--Statistics--Inferences and Sample Size--05 |
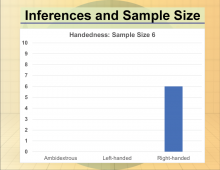
Math Clip Art--Statistics--Inferences and Sample Size--05This is part of a collection of math clip art images that show different statistical graphs and concepts, along with some probability concepts. |
|
Data Gathering |
Math Clip Art--Statistics--Inferences and Sample Size--06 |
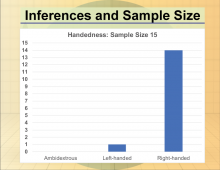
Math Clip Art--Statistics--Inferences and Sample Size--06This is part of a collection of math clip art images that show different statistical graphs and concepts, along with some probability concepts. |
|
Data Gathering |
Math Clip Art--Statistics--Inferences and Sample Size--07 |
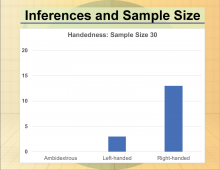
Math Clip Art--Statistics--Inferences and Sample Size--07This is part of a collection of math clip art images that show different statistical graphs and concepts, along with some probability concepts. |
|
Data Gathering |
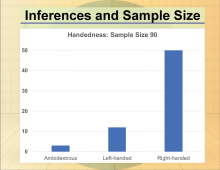
Math Clip Art--Statistics--Inferences and Sample Size--08 |
Math Clip Art--Statistics--Inferences and Sample Size--08This is part of a collection of math clip art images that show different statistical graphs and concepts, along with some probability concepts. |
|
Data Gathering |
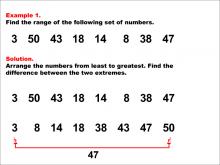
Math Example--Measures of Central Tendency--Range: Example 1 |
Math Example--Measures of Central Tendency--Range: Example 1This is part of a collection of math examples that focus on calculating measures of central tendency: mean, median, mode, and range. |
|
Data Analysis |
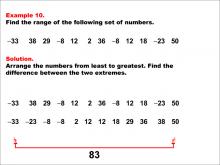
Math Example--Measures of Central Tendency--Range: Example 10 |
Math Example--Measures of Central Tendency--Range: Example 10This is part of a collection of math examples that focus on calculating measures of central tendency: mean, median, mode, and range. |
|
Data Analysis |
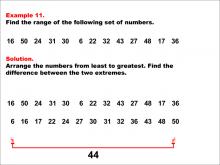
Math Example--Measures of Central Tendency--Range: Example 11 |
Math Example--Measures of Central Tendency--Range: Example 11This is part of a collection of math examples that focus on calculating measures of central tendency: mean, median, mode, and range. |
|
Data Analysis |

