These are the resources that support this Florida Standard.
MAFS.6.SP.2.5: Summarize numerical data sets in relation to their context, such as by:
a. Reporting the number of observations.
b. Describing the nature of the attribute under investigation, including how it was measured and its units of measurement.
c. Giving quantitative measures of center (median and/or mean) and variability (interquartile range and/or mean absolute deviation), as well as describing any overall pattern and any striking deviations from the overall pattern with reference to the context in which the data were gathered.
d. Relating the choice of measures of center and variability to the shape of the data distribution and the context in which the data were gathered.
There are 222 resources.
| Title | Description | Thumbnail Image | Curriculum Topics |
|---|---|---|---|
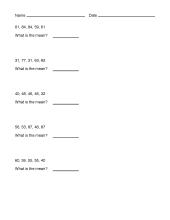
Math Worksheet Collection: Data Analysis: Mean, Median, and Mode |
Math Worksheet Collection: Data Analysis: Mean, Median, and Mode |
|
Data Analysis |
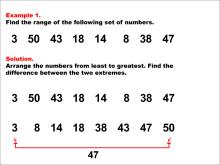
Math Examples Collection: Range |
Overview |
|
Data Analysis |
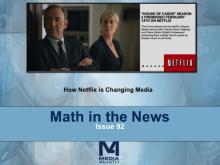
Math in the News Collection: Business Math |
Overview |
|
Applications of Exponential and Logarithmic Functions, Data Analysis and Volume |
Math in the News Collection: Applications of Data Analysis |

|
Data Analysis, Data Gathering, Probability, Percents and Ratios and Rates | |
Quizlet Flash Card Collection: Measures of Central Tendency |
|
Data Analysis | |
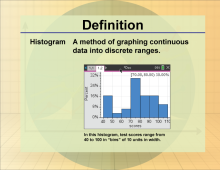
Math Definitions Collection: Statistics and Probability |
|
Data Analysis, Probability and Data Gathering | |
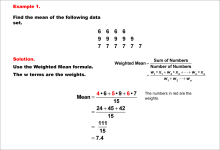
Math Examples Collection: Weighted Mean |
|
Data Analysis | |
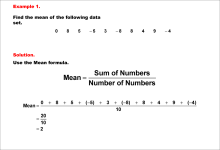
Math Examples Collection: The Mean of Data Sets with Negative Numbers |
Overvie |
|
Data Analysis |
Math Video Collection: Texas Instruments Tutorial Videos |
Overview This colle |
|
Rational Expressions, Sequences, Series, Polynomial Functions and Equations, Graphs of Quadratic Functions, Quadratic Equations and Functions, Solving Systems of Equations, Trig Expressions and Identities, Probability, Geometric Constructions with Triangles, Composite Functions, Geometric Constructions with Angles and Planes, Distance Formula, Data Analysis, Slope, Special Functions, Trigonometric Functions, Graphs of Exponential and Logarithmic Functions, Radical Functions and Equations, Rational Functions and Equations, Slope-Intercept Form, Coordinate Systems, Graphs of Linear Functions, Inequalities, Matrix Operations and Midpoint Formula |
Math Video Collection: Video Tutorials Series: Measures of Central Tendency |
Overview This co |

|
Data Analysis and Data Gathering |
Math Video Collection: Algebra Applications Video Series: Data Analysis |
Overv |
|
Data Analysis and Data Gathering |
Math Clip Art Collection: Statistics |
Overview This colle |
|
Data Analysis, Probability, Data Gathering and Counting |
VIDEO: Algebra Applications: Data Analysis |
VIDEO: Algebra Applications: Data AnalysisIn this episode of Algebra Applications, students explore the dramatic events of 2008 related to the mortgage crisis. Brought about principally through mortgage defaults, the effect on the overall economy was severe. |
|
Data Analysis and Data Gathering |
VIDEO: Algebra Nspirations: Data Analysis and Probability |
VIDEO: Algebra Nspirations: Data Analysis and ProbabilityWhat are the two meanings of statistics? What does it really mean that an event has a 50% probability of occurring? Why are data analysis and probability always taught together? Written and hosted by internationally acclaimed math educator Dr. |
|
Data Analysis and Data Gathering |
Closed Captioned Video: A Probability Simulation 2 |
Closed Captioned Video: A Probability Simulation 2In this TI Nspire tutorial, the Spreadsheet and Statistics windows are used to create a probability simulation of a coin toss. This video supports the TI-Nspire Clickpad and Touchpad. This Mini-Tutorial Video includes a worksheet. . |
|
Probability |
Closed Captioned Video: A Probability Simulation 3 |
Closed Captioned Video: A Probability Simulation 3In this TI Nspire tutorial, the Spreadsheet and Statistics windows are used to create a probability simulation of tossing two coins. This video supports the TI-Nspire Clickpad and Touchpad. This Mini-Tutorial Video includes a worksheet. . |
|
Probability |
Closed Captioned Video: Algebra Applications: Data Analysis |
Closed Captioned Video: Algebra Applications: Data AnalysisIn this episode of Algebra Applications, students explore the dramatic events of 2008 related to the mortgage crisis. Brought about principally through mortgage defaults, the effect on the overall economy was severe. |
|
Data Analysis and Data Gathering |
Closed Captioned Video: Algebra Applications: Data Analysis, 1 |
Closed Captioned Video: Algebra Applications: Data Analysis, Segment 1: IntroductionIn this introductory segment students learn about the mortage crisis of 2008. In the process they get a brief introduction to what a mortgage is. |

|
Data Analysis and Data Gathering |
Closed Captioned Video: Algebra Applications: Data Analysis, 2 |
Closed Captioned Video: Algebra Applications: Data Analysis, Segment 2: What Is a Mortgage?The time value of money is at the basis of all loans. Students learn about the key factors that determine monthly mortgage payments and use the TI-Nspire to create an amortization table. |

|
Data Analysis and Data Gathering |
Closed Captioned Video: Algebra Applications: Data Analysis, 3 |
Closed Captioned Video: Algebra Applications: Data Analysis, Segment 3: What Is a What is a Subprime Mortgage?Having learned the general features of a mortgage, students learn the specifics of a subprime mortgage. With this comes the notion of a credit score, and with credit scores come the probabilities for a loan default. |
|
Data Analysis and Data Gathering |
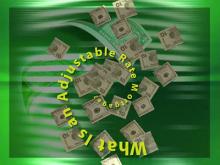
Closed Captioned Video: Algebra Applications: Data Analysis, 4 |
Closed Captioned Video: Algebra Applications: Data Analysis, Segment 4: What is an Adjustable Rate Mortgage?Another factor in the mortgage crisis was the use of adjustable rate mortgages. |
|
Data Analysis and Data Gathering |
Closed Captioned Video: Algebra Nspirations: Data Analysis and Probability |
Closed Captioned Video: Algebra Nspirations: Data Analysis and ProbabilityWhat are the two meanings of statistics? What does it really mean that an event has a 50% probability of occurring? Why are data analysis and probability always taught together? Written and hosted by internationally acclaimed math educator Dr. |
|
Data Analysis and Data Gathering |
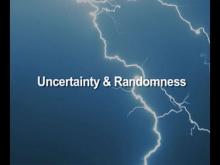
Closed Captioned Video: Algebra Nspirations: Data Analysis and Probability, 1 |
Closed Captioned Video: Algebra Nspirations: Data Analysis and Probability, Segment 1In this Investigation we explore uncertainty and randomness. This video is Segment 1 of a 4 segment series related to Data Analysis and Probability. Segments 1 and 2 are grouped together. |
|
Data Analysis and Data Gathering |
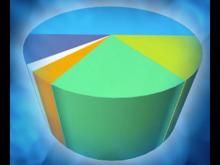
Closed Captioned Video: Algebra Nspirations: Data Analysis and Probability, 3 |
Closed Captioned Video: Algebra Nspirations: Data Analysis and Probability, Segment 3In this Investigation we look at real-world data involving endangered wolf populations. This video is Segment 3 of a 4 segment series related to Data Analysis and Probability. Segments 3 and 4 are grouped together. |
|
Data Analysis and Data Gathering |
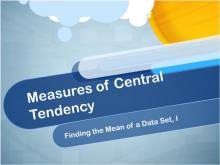
Closed Captioned Video: Measures of Central Tendency: Finding the Mean of a Data Set I |
Closed Captioned Video: Measures of Central Tendency: Finding the Mean of a Data Set IIn this video tutorial students learn how to calculate the mean when all of the data items are positive numbers. Includes three real-world examples. |
|
Data Analysis and Data Gathering |
Join the hundreds of thousands of math educators who have used Media4Math resources in their classroom to engage their students. Our new integrated Library/Classroom product has everything you need!
About Media4Math
Our Mission
Media4Math's mission is to educate 21st-century students in real-world applications of math with digital technology. We bring math to life in your classroom with a rich blend of resources to inspire your students to learn. Our philosophy is that the procedural side of math is a prerequisite to using it, but we also find that real-world math applications can provide motivation and even inspiration for math students. Math is its own language and it has important stories to tell. While many of our resources are for procedural skills, there are many resources that are real-world applications of math. Some of these resources rely on partnerships with other educational publishers.
About Media4Math Library
Media4Math Library contains over 15,000 high-quality resources designed for classroom or home use. This includes instructional, remediation, and assessment resources. You'll find truly innovative resources that bring math to life. Resources in Media4Math Library include:
- Videos
- Math Clip Art
- Math Examples
- Quizzes
- Tutorials
- PowerPoint and Google Slide presentations
- GoogleEarth Voyager Stories
- Algebra Applications
- Geometry Explorations
- Quizlet Flash Cards
- Desmos Resources
- Texas Instrument Resources
- Games and Simulations
About Media4Math Classroom
Media4Math Classroom provides ready-to-use interactive math lessons that teach, assess, and provide real-world applications of topics in Pre-Algebra, Algebra, and Geometry. Assign these modules to your students and capture assessment scores in an easy-to-use Dashboard. This is a growing library of instructional modules. Topics include:
- Arithmetic
- Pre-Algebra
- Algebra
- Geometry
- SAT Math Prep
Media4Math Classroom modules provide real world applications of math that will motivate your students. Here are some examples:
- Construction Site Math. Apply ratios and proportions to mixtures of cement and concrete. This module includes video resources and your students will get a real-world application of ratios and proportions.
- Counting Bison. Apply place value concepts to the real-world application of the bison population. Because the bison population has gone through dramatic changes in population, this become an opportunity to use and apply place value.
- Wildlife Refuge. This study of area and perimeter centers on the mustang population in the Nevada area. Students explore the relationship between area and perimeter of rectangular shapes in the context of designing a wildlife refuge.
The Media4Math Bundle
A subscription to the Media4Math bundle gives teachers access to all the resources listed above. Specifically:
- Access to all the Media4Math Library resources and tools.
- Access to all the Media4Math Classroom instructional modules.
To learn more about our subscription packages, contact us at admin@media4math.com.
Partnering with Media4Math
Media4Math prides itself on its strategic partnerships with other educational organizations. Our partnerships include the following partners:
-
Google Earth. Media4Math has partnered with GoogleEarth to create a comprehensive library of GoogleEarth Voyager Stories. These map-based explorations of geometry, geography, and culture will literally bring the math to life. See our collection of Voyager Stories by clicking on this link to the Google Earth resources.
-
Texas Instruments. TI is the leading provider of graphing calculators used in the classroom. Media4Math has partnered with TI to create a library of digital resources to support the use of these graphing calculators. These resources include videos, presentations, and related tutorials. See our collection of TI resources by clicking on this link to the TI resources.
-
Desmos. This free online resource that includes a graphing calculator and geometry tools. Media4Math has created an extensive library of resources that support the use of these Desmos resources. See our collection of Desmos resources by clicking on this link to the Desmos resources.
- Quizlet. We have partnered with the leading provider of interactive Flash Cards and is used by millions of teachers and students around the world. Media4Math has developed an extensive library of Quizlet resources. See our collection of Quizlet resources by clicking on this link to the Quizlet resources.
Link to the Media4Math Study Sets on Quizlet and search for "Media4Math."
- The Princeton Review. The Princeton Review is the leading provider of SAT prep and other test preparation courses and tutorials. Media4Math is an affiliate of Princeton Review and we have created a set of free SAT math resources, sponsored by Princeton Review. See this collection of SAT resources by clicking on this link to the Princeton Review resources.
If you would like to partner with Media4Math, please reach out to us at admin@media4math.com.