These are the resources that support this Florida Standard.
MA.912.DP.3.5 - Solve real-world problems involving univariate and bivariate categorical data.
Displaying 1 - 17 of 17 resources:
| Thumbnail Image | Title | Description | Curriculum Nodes |
|---|---|---|---|
|
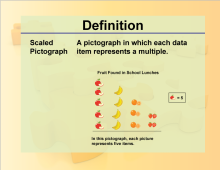
Math Definitions Collection: Charts and Graphs |
This collection aggregates all the definition image cards around the topic of Charts and Graphs. There are a total of 16 terms. | Data Analysis |
|
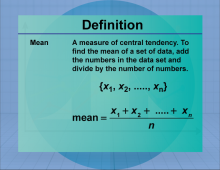
Math Definitions Collection: Measures of Central Tendency |
This collection aggregates all the definition image cards around the topic of Measures of Central Tendency terms and vocabulary. There are a total of 31 terms. | Data Analysis |
|
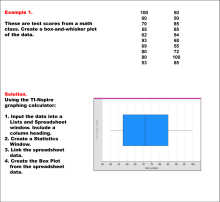
Math Examples Collection: Charts, Graphs, and Plots |
This collection aggregates all the math examples around the topic of Charts, Graphs, and Plots. There are a total of 38 Math Examples. This collection of resources is made up of downloadable PNG images that you can easily incorporate into your lesson plans. | Slope-Intercept Form, Data Analysis, Point-Slope Form and Subtraction Facts to 100 |

|
Math Examples Collection: Graphs From Categorical Data |
This collection aggregates all the math examples around the topic of Graphs of Categorical Data. There are a total of 6 Math Examples. | Data Analysis |
|
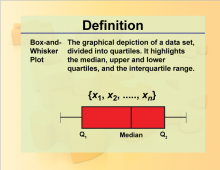
Definition--Charts and Graphs--Box-and-Whisker Plot |
Definition--Charts and Graphs--Box-and-Whisker Plot
This is a collection of definitions related to the concept of charts, graphs, and data displays. |
Data Analysis |
|
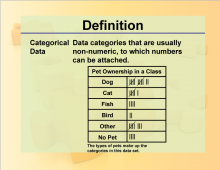
Definition--Charts and Graphs--Categorical Data |
Definition--Charts and Graphs--Categorical Data
This is a collection of definitions related to the concept of charts, graphs, and data displays. |
Data Analysis |
|
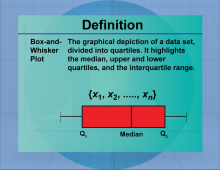
Definition--Measures of Central Tendency--Box-and-Whisker Plot |
Definition--Measures of Central Tendency--Box-and-Whisker Plot
This is a collection of definitions related to measures of central tendency and related concepts. |
Data Analysis |
|
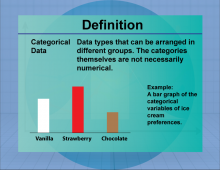
Definition--Measures of Central Tendency--Categorical Data |
Definition--Measures of Central Tendency--Categorical Data
This is a collection of definitions related to measures of central tendency and related concepts. |
Data Analysis |
|
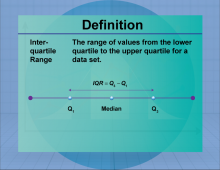
Definition--Measures of Central Tendency--Interquartile Range |
Definition--Measures of Central Tendency--Interquartile Range
This is a collection of definitions related to measures of central tendency and related concepts. |
Data Analysis |
|
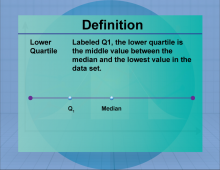
Definition--Measures of Central Tendency--Lower Quartile |
Definition--Measures of Central Tendency--Lower Quartile
This is a collection of definitions related to measures of central tendency and related concepts. |
Data Analysis |
|
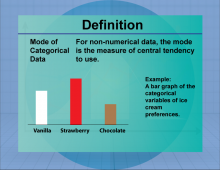
Definition--Measures of Central Tendency--Mode of Categorical Data |
Definition--Measures of Central Tendency--Mode of Categorical Data
This is a collection of definitions related to measures of central tendency and related concepts. |
Data Analysis |
|
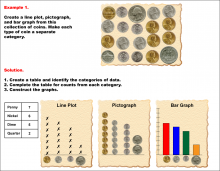
Math Example--Charts, Graphs, and Plots--Graphs of Categorical Data--Example 1 |
Math Example--Charts, Graphs, and Plots-- Graphs of Categorical Data--Example 1
In this set of math examples, analyze the behavior of different scatterplots. This includes linear and quadratic models. |
Data Analysis |
|
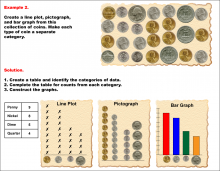
Math Example--Charts, Graphs, and Plots--Graphs of Categorical Data--Example 2 |
Math Example--Charts, Graphs, and Plots-- Graphs of Categorical Data--Example 2
In this set of math examples, analyze the behavior of different scatterplots. This includes linear and quadratic models. |
Data Analysis |
|
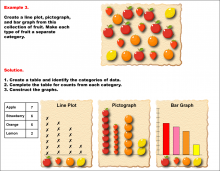
Math Example--Charts, Graphs, and Plots--Graphs of Categorical Data--Example 3 |
Math Example--Charts, Graphs, and Plots-- Graphs of Categorical Data--Example 3
In this set of math examples, analyze the behavior of different scatterplots. This includes linear and quadratic models. |
Data Analysis |
|
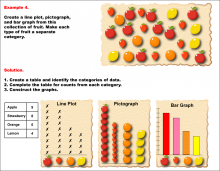
Math Example--Charts, Graphs, and Plots--Graphs of Categorical Data--Example 4 |
Math Example--Charts, Graphs, and Plots-- Graphs of Categorical Data--Example 4
In this set of math examples, analyze the behavior of different scatterplots. This includes linear and quadratic models. |
Data Analysis |
|
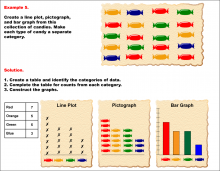
Math Example--Charts, Graphs, and Plots--Graphs of Categorical Data--Example 5 |
Math Example--Charts, Graphs, and Plots-- Graphs of Categorical Data--Example 5
In this set of math examples, analyze the behavior of different scatterplots. This includes linear and quadratic models. |
Data Analysis |
|
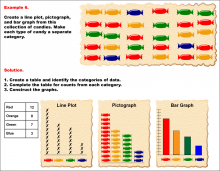
Math Example--Charts, Graphs, and Plots--Graphs of Categorical Data--Example 6 |
Math Example--Charts, Graphs, and Plots-- Graphs of Categorical Data--Example 6
In this set of math examples, analyze the behavior of different scatterplots. This includes linear and quadratic models. |
Data Analysis |